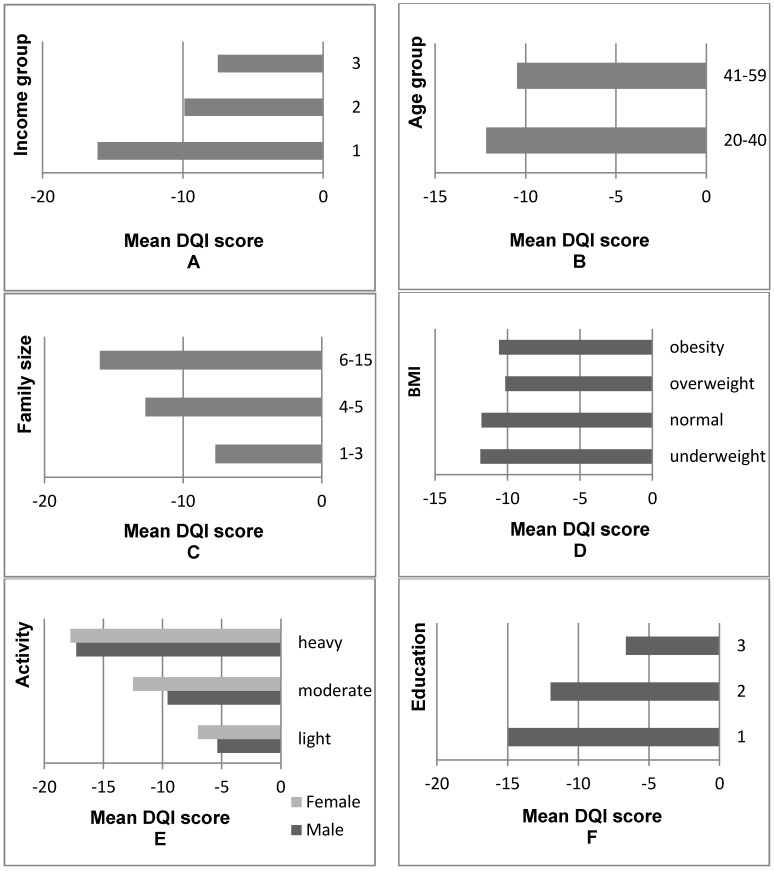
Figure 1.
Comparison of DQI values across different groups. (A) 1: the poorest group; 2: middle income group; 3: the richest group; (B) Young adult: 20–40 years old, old adult: 41–59 years old; (C) Number of individuals in the family; (D) Underweight: Body Mass Index (BMI) < 18.5 kg·m−2; normal: 18.5 ≤ BMI ≤ 23.9 kg·m−2; overweight: 24.0 ≤ BMI ≤ 27.9 kg·m−2; general obesity: BMI ≥ 28.0 kg·m−2; (E) Light: very light and light physical activity; moderate: moderate physical activity; heavy: heavy and very heavy physical activity; (F) Education: 1 = primary education; 2 = secondary education; 3 = tertiary education.

