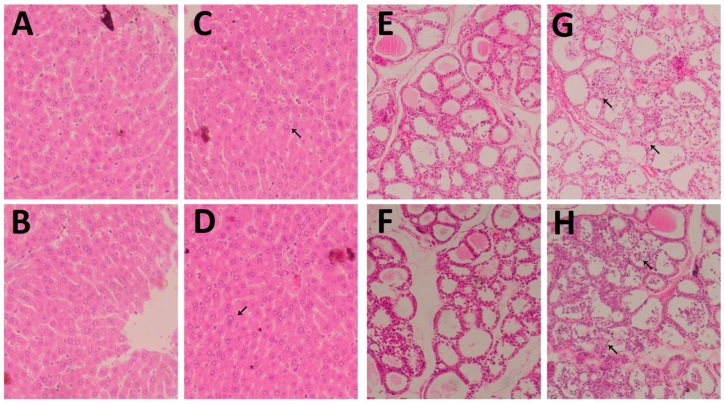
Figure 2.
Effects of DEHP on the histology of thyroids and liver. Histopathology of thyroid and liver sections collected from Wistar rats treated with DEHP by gavage for 3 M and 6 M. Representative photomicrographs of H&E-stained formalin-fixed thyroid and liver sections from control group or high DEHP-dosed group. Histopathology of liver: (A) Control group at 3 M; (B) Control group at 6 M; (C) High-dose group at 3 M; (D) High-dose group at 6 M. Histopathology of thyroid: (E) Control group at 3 M; (F) Control group at 6 M; (G) High-dose group at 3 M; (H) High-dose group at 6 M. Control group (0 mg/kg/day); High-dose group (600 mg/kg/day). Arrows indicate hypertrophy and hyperplasia of follicular epithelial cells. Magnification: ×400 (liver) and ×200 (thyriod).

