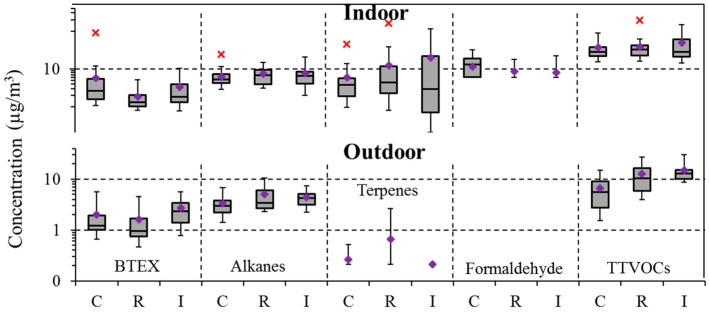
Figure 4.
Box plots of BTEX, alkane, terpene, formaldehyde, and TTVOC concentrations indoors and outdoors by community type: no-local emission source or clear (C), road (R), and industrial (I). Plots show 5th, 25th, 50th, 75th and 95th percentile concentrations. Diamond (♦) denotes mean. Asterisk (x) denotes outliers.

