
Figure 6. PI3K/mTOR pathway inhibition restricts the growth of MYCN-driven transgenic tumors.
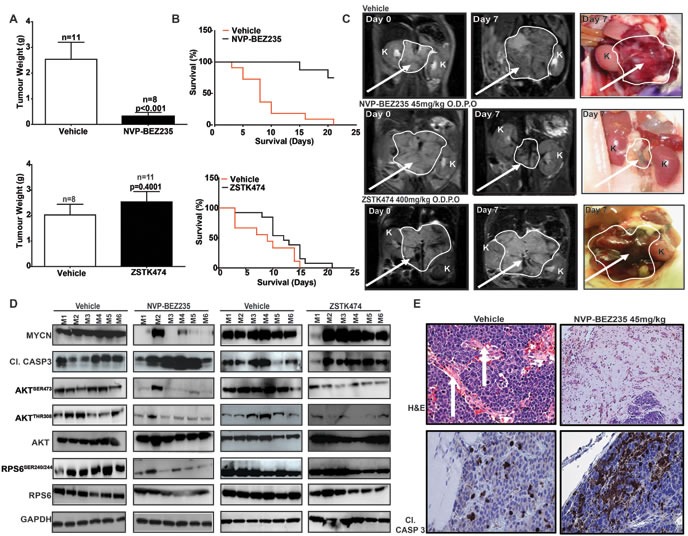
Tumor-bearing animals transgenic for TH-MYCN were treated daily using oral gavage with 45mg/kg NVP-BEZ235 (n = 8), NVP-BEZ235 vehicle (n = 11), 400mg/kg ZSTK474 (n = 11) or ZSTK474 vehicle (n = 8). A. Average weight (g) of resected tumors relative to vehicle for NVP-BEZ235 (top panel) and ZSTK474 (lower panel). B. Kaplan-Meier 21 day survival curves for NVP-BEZ235 (top panel) or ZSTK474 (bottom panel). C. Representative T2-weighted MRI images and gross pathology of vehicle NVP-BEZ235 or ZSTK474 treated tumors at indicated times (arrow = tumor, K, kidney). D. Western blot analysis of tumors treated with NVP-BEZ235, ZSTK474 or respective vehicles. M1-M6 indicates tumor samples from cohorts of 6 individual animals, treated with either NVP-BEZ235, ZSTK474 or their respective vehicle controls. E. Tumor pathology (Hematoxylin & Eosin) and immunochemical staining (cl. Casp. 3) for vehicle (left panels) and NVP-BEZ235 treated (right panels) tumors. (White arrows = vascularization). See also Figure S3.