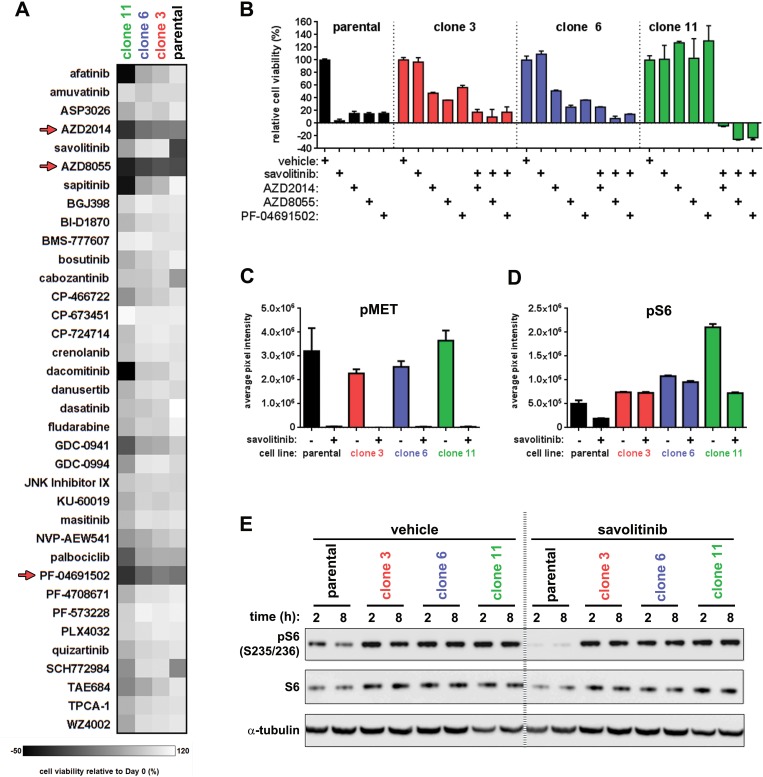
Figure 6. A chemical screen reveals that dual mTORC1/2 inhibitors resensitize resistant cells to savolitinib.
A., cell viability heatmap for parental H1993 cells and clones treated with the indicated compounds for five days. Cells were treated with a nine-point dose response curve of each drug ranging from 11.1 μM to 1.7 nM. Parental H1993 cells and clones were seeded in media containing 0.1% DMSO or 100 nM savolitinib, respectively. Dual mTORC1/2 inhibitors are indicated with red arrows. For clarity, the viability data from only one of the nine doses tested for each drug (137 nM) are shown. B., five-day viability assay for parental H1993 cells treated with single-agent savolitinib or the indicated mTORC1/2 inhibitors. Clones were treated with each mTORC1/2 inhibitor alone or in combination with 100 nM savolitinib. Data shown are the mean ± s.d. cell viabilities determined at 412 nM of each mTORC1/2 inhibitor, which is a concentration near the middle of the nine-point dose response curve tested. C.-D., phospho-protein array densitometry. Data shown are the mean ± S.D. of duplicate spots on the array. pMET signal represents pan-tyrosine phosphorylation of MET; pS6 signal represents phosphorylation at S235/236. E. confirmation of phospho-protein array results revealing differential modulation of pS6 (S235/236) levels between parental H1993 cells and resistant clones following MET inhibition. Cells were treated with 0.1% DMSO or 100 nM savolitinib for two or eight hours and lysates analyzed by immunoblot. α-tubulin serves as a loading control.

