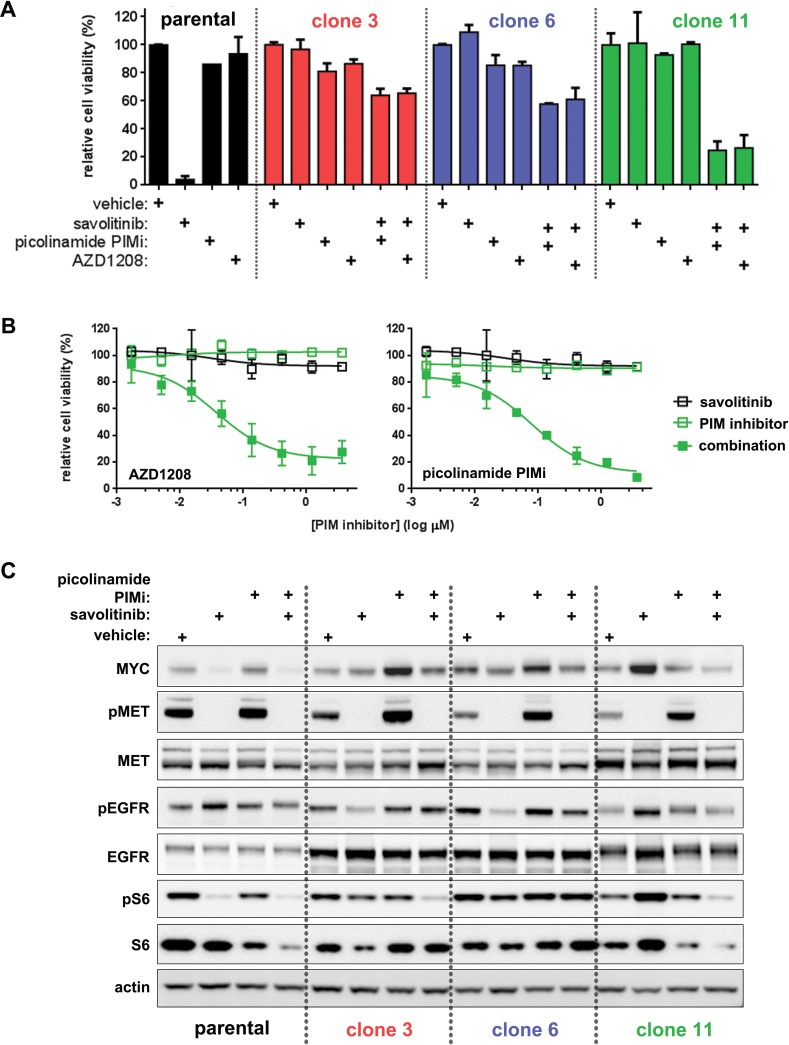
Figure 7. Clone-specific restoration of savolitinib sensitivity by PIM kinase inhibitors.
A., five-day viability assay for parental H1993 cells treated with single-agent savolitinib or the indicated PIM inhibitors. Clones were treated with each PIM inhibitor alone or in combination with 100 nM savolitinib. Data shown are the mean ± s.d. cell viabilities determined at 412 nM of each PIM inhibitor, which is a concentration near the middle of the nine-point dose response curve tested. B., full dose response plots of cell viability shown in panel A for clone 11 cells treated with a dose range of savolitinib alone (open black squares), each PIM inhibitor alone (open green squares) or combination of 100 nM savolitinib with a dose range of each PIM inhibitor (solid green squares). C., immunoblot analysis of MYC, pEGFR and pS6 in parental H1993 cells and clone 3, clone 6 and clone 11 cells treated with vehicle, 100 nM savolitinib, 100 nM picolinamide PIMi or the combination (100 nM each) for eight hours.

