
Figure 6. Molecular docking and molecular dynamics simulation results showing the binding of honokiol to the kinase domain of EGFR.
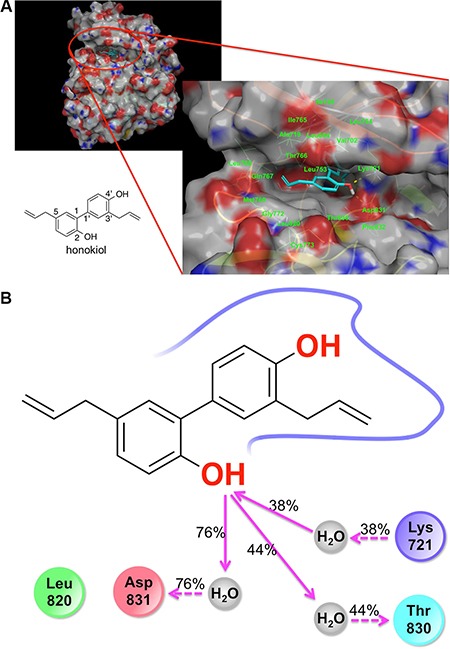
(A) Docking pose of honokiol in the kinase domain of the EGFR. Gray color represents carbon and hydrogen. Blue color indicates nitrogen atom. Red color represents oxygen. (B) 2D interaction map of honokiol in the kinase domain of EGFR as obtained from molecular dynamics simulation studies: red, negatively charged amino acid; blue, positively charged amino acid; cyan, polar amino acid; green, hydrophobic amino acid; gray, water; pink solid arrow, H-bond with the backbone of the protein; pink dotted arrow, H-bond with the side chains of the amino acid residues of the protein; % values, the percent of the MD simulation time in which H-bond was formed.