
Figure 2. Overexpression of SATB2 in HPNE cells induces cellular transformation and stemness.
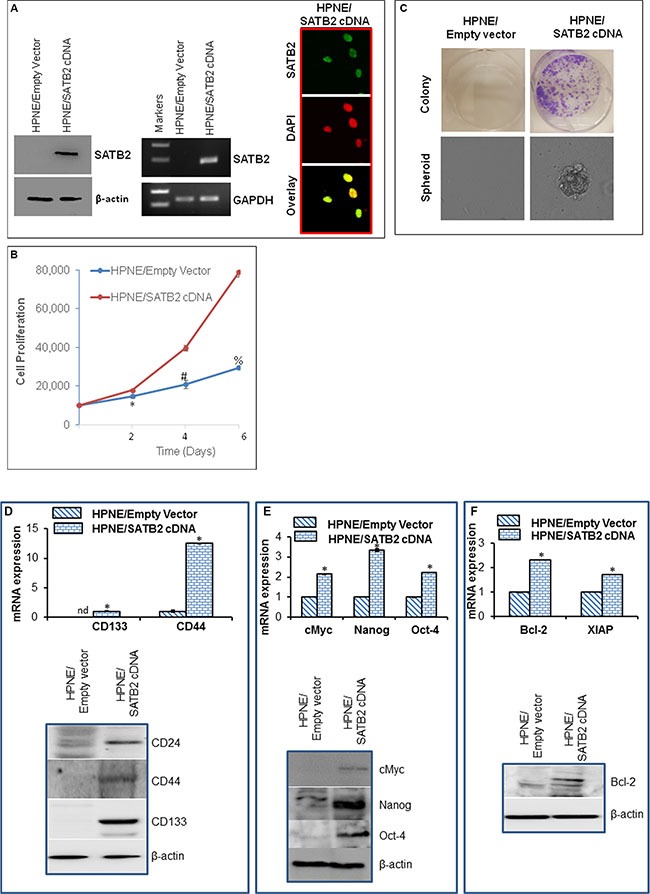
(A) HPNE cells were stably transduced with lentiviral particles expressing either empty vector or SATB2 cDNA. SATB2 expression was measured by the Western blot analysis, RT-PCR and immunocytochemistry. (B), Proliferation of HPNE/Empty Vector and HPNE/SATB2 cDNA cells was measured for 6 days. Data represent mean (n = 4) ± SD. *, # and % = significantly different from respective empty vector groups, P < 0.05. (C), Colony and spheroid formation. Colony formation in soft agar and spheroid formation in suspension of HPNE/Empty Vector and HPNE/SATB2 cDNA cells were measured. (D) Upper panel, RNA expression of stem cell markers. RNA was isolated and the expression of stem cell markers (CD133 and CD44) was measured by qRT-PCR analysis. Data represent mean (n = 4) ± SD. * = significantly different from HPNE/Empty Vector group (P < 0.05). Gene expression of HPNE/Empty Vector cells was normalized to 1. Lower panel, Protein expression of stem cell markers. Cell lysates were collected from HPNE/Empty Vector and HPNE/SATB2 cDNA cells, and the expression of CD24, CD44 and CD133 was measured by the Western blot analysis. β-actin was used as a loading control. (E) Upper panel, RNA was isolated and the expression of transcription factors (c-Myc, Nanog and Oct-4) was measured by qRT-PCR analysis. Data represent mean (n = 4) ± SD. * = significantly different from HPNE/Empty Vector group (P < 0.05). Gene expression of HPNE/Empty Vector cells was normalized to 1. Lower panel, Protein expression of c-Myc, Nanog and Oct-4 Cell lysates were collected from HPNE/Empty Vector and HPNE/SATB2 cDNA cells, and the expression of c-Myc, Nanog and Oct-4 was measured by the Western blot analysis. β-actin was used as a loading control. (F), Upper panel, RNA was isolated and the expression of Bcl-2 and XIAP was measured by qRT-PCR analysis. Data represent mean (n = 4) ± SD. * = significantly different from HPNE/Empty Vector group (P < 0.05). Gene expression of HPNE/Empty Vector cells was normalized to 1. Lower panel, Protein expression of Bcl-2. Cell lysates were collected from HPNE/Empty Vector and HPNE/SATB2 cDNA cells, and the expression of Bcl-2 was measured by the Western blot analysis. β-actin was used as a loading control.