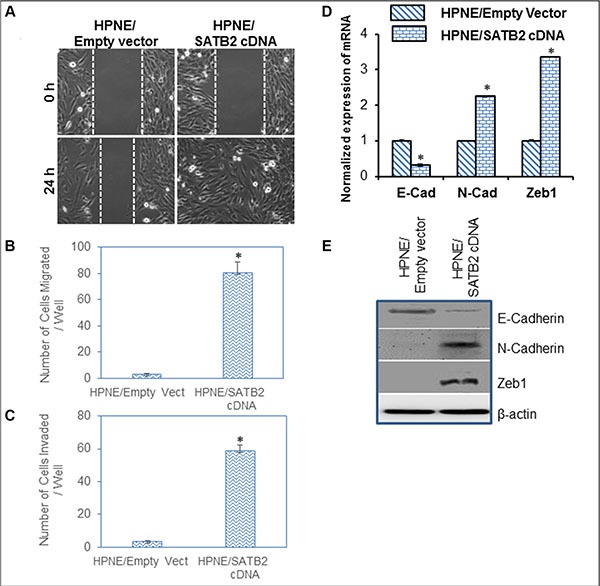
Figure 4. Overexpression of SATB2 in HPNE cells induces EMT characteristics.

(A) Cell Motility assay. HPNE/Empty Vector and HPNE/SATB2 cDNA cells were grown in petri dishes. After cell attachment, scratch lines were made with the fine pipette tips in both the groups. Phase contrast images of cells were captured at 0 h and 24 h time points. (B) Transwell Migration Assay. 1 × 10⁵ cells were plated on to the top chamber of the noncoated membrane (24-well insert; pore size, 8 μm; Corning Costar) and allowed to migrate toward serum-containing medium in the lower chamber. Cells were fixed after 24 hours of incubation with methanol and stained with Diff-Quick Fixative Solutions. Data represent mean (n = 4) ± SD. * = significantly different at P < 0.05. (C) Transwell Invasion Assay. 1 × 10⁵ cells were plated on to the top chamber of the Matrigel coated Membrane. After 48 hours, Matrigel-coated inserts were fixed and stained. The number of cells invading through the membrane was counted. Data represent mean ± SD. * = significantly different at P < 0.05. (D) Expression of E-Cadherin, N-cadherin and Zeb1 in HPNE/Empty Vector and HPNE/SATB2 cDNA cells. RNA was isolated and the expression of E-Cadherin, N-cadherin and Zeb1 was measured by qRT-PCR analysis. Data represent mean (n = 4) ± SD. * = significantly different from HPNE/Empty Vector group (P < 0.05). Gene expression of HPNE/Empty Vector group was normalized to 1. (E), Protein expression of E-Cadherin, N-cadherin and Zeb1. Cell lysates were collected from HPNE/Empty Vector and HPNE/SATB2 cDNA cells, and the expression of E-Cadherin, N-cadherin and Zeb1 was measured by the Western blot analysis. β-actin was used as a loading control.
