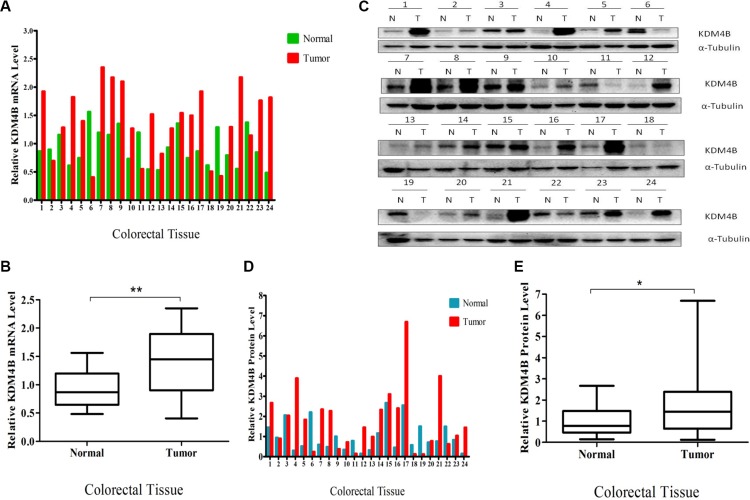
Figure 1. Overexpression of KDM4B in clinical colorectal cancer.
(A) Quantitative real-time PCR of KDM4B was performed using 24 pairs of colorectal tissues including 24 colorectal tumor tissues and 24 corresponding colorectal normal tissues. (B) Quantitative real-time PCR results are shown in the box-whisker plot. Student's t test (P < 0.01). (C) Western blot analysis of KDM4B protein expression in 24 pairs of colorectal tissues. (D) Quantification of KDM4B protein in colorectal tissues. Band intensities were measured using Image J and normalized to α-tubulin. (E) Quantification of KDM4B is shown by box-whisker plot. Student's t test (P < 0.05).

