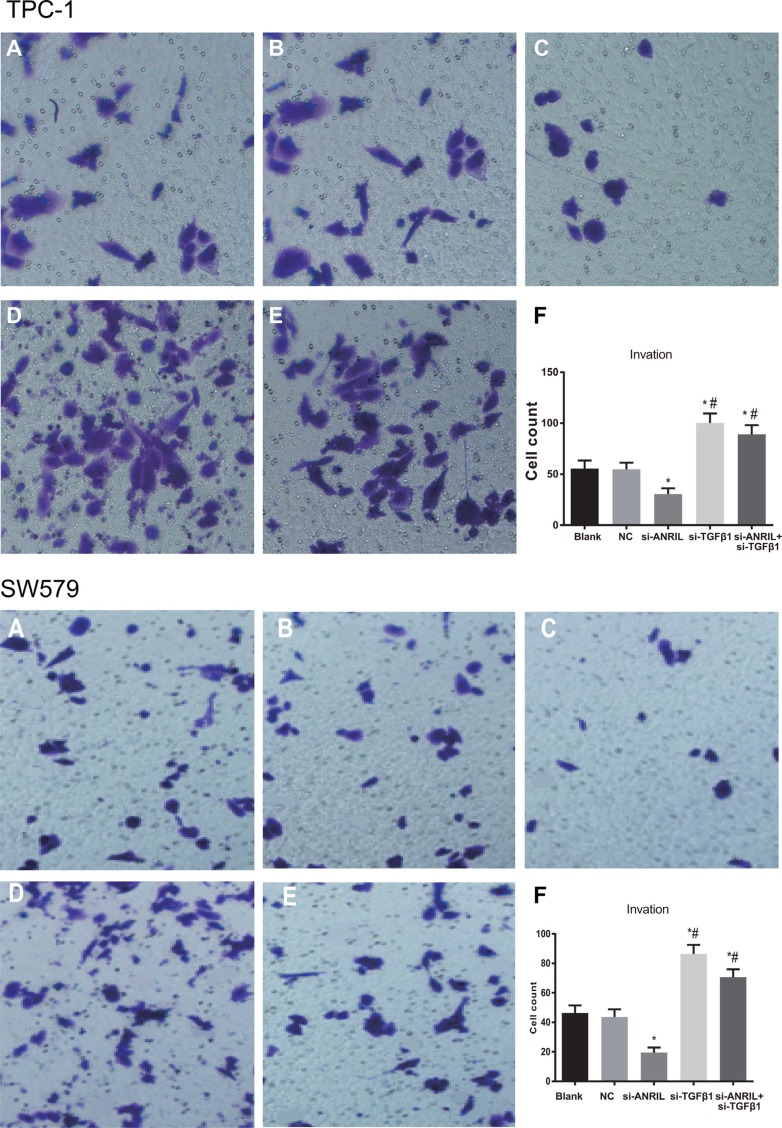
Figure 6. The invasion ability of TPC-1 and SW579 cells in each group by transwell assay after transfection (×200).
(A) blank group; (B) negative control (NC) group; (C) si-ANRIL group; (D) si-TGF-β1 group; (E) si-ANRIL + si-TGF-β1 group; (F) Transwell invasion histogram of TPC-1 cells in each group after transfection; *, compared with blank group and NC, P < 0.05; #,compared with si-ANRIL group, P < 0.05.

