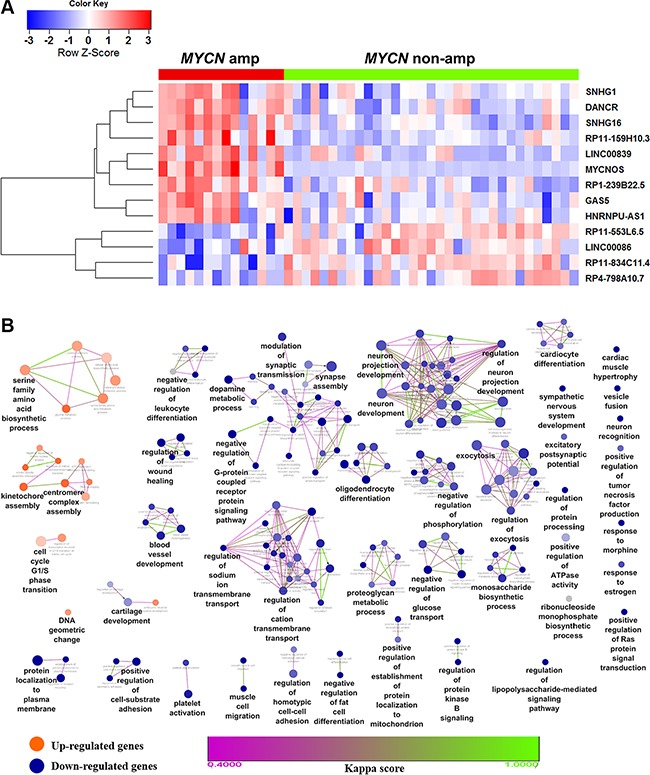
Figure 1. Heatmap of differentially expressed lncRNAs and biological functions of de-regulated coding genes in NB.

(A) Heatmap showing the expression values of lncRNAs found differentially expressed in MYCN amplified compared with MYCN non-amplified patient samples. Each column indicates a MYCN amplified (grouped in red bar) or non-amplified (green) patients samples. Each row represents the lncRNA ordered by hierarchical clustering analysis. Expression value of each lncRNA was scaled across samples and represented in a blue-red color scale. (B) Functional enrichment map of differentially expressed coding genes. Nodes represent GO terms and edges represent genes shared between GO terms (kappa score threshold = 0.4). Edge color gradient represents kappa score. Overview GO terms are shown by the highest statistically enriched term in each group formed by fusion of the GO terms sharing similar genes. Clusters with orange color are enriched functions for up-regulated genes while blue clusters are for down-regulated genes. Node color gradient represents the proportion of up (orange) or down-regulated (blue) genes associated with the term. A node (GO term) with equal proportion of up and down-regulated genes is represented in grey color.
