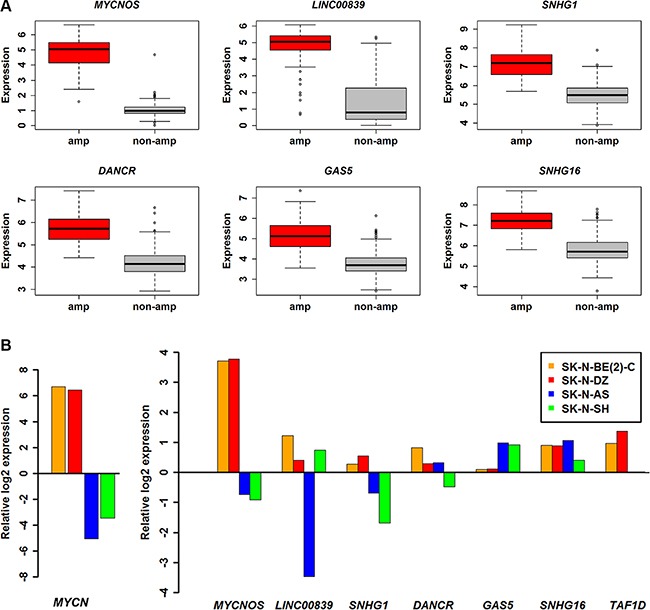
Figure 2. Expression profile of potential lncRNAs.

(A) Boxplot showing six lncRNAs expression profiles in MYCN amplified (n = 92) and MYCN non-amplified (n = 401). (B) Bar charts of expression levels measured by RT-qPCR in NB cell lines. The expression levels were normalized to endogenous GAPDH and relative to SK-N-F1 and displayed in log2 scale. MYCN and TAF1D are also shown for comparison.
