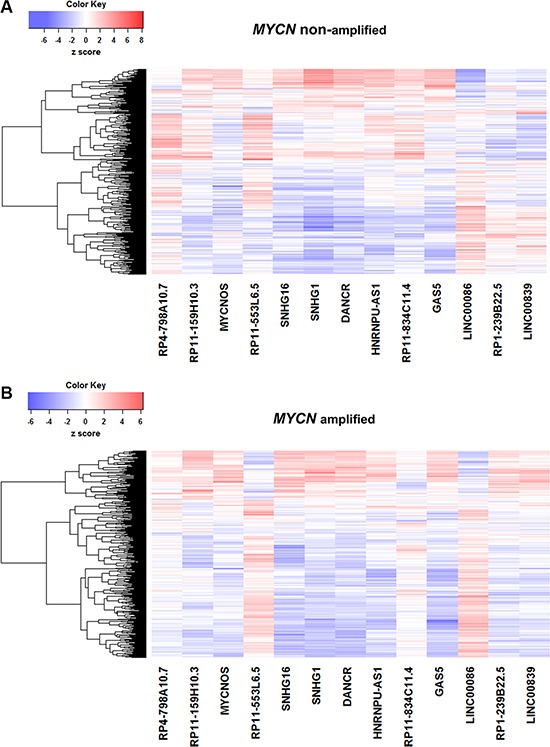
Figure 3. Correlation of lncRNA and coding gene expression profiles.

Fisher's Z-transformed score of Spearman's correlation coeffiecient (SCC) between lncRNAs (n = 13) and coding genes (n = 591) in (A) MYCN amplified and (B) MYCN non-amplified neuroblastoma tumor samples. Dendrograms of coding genes (rows) are displayed.
