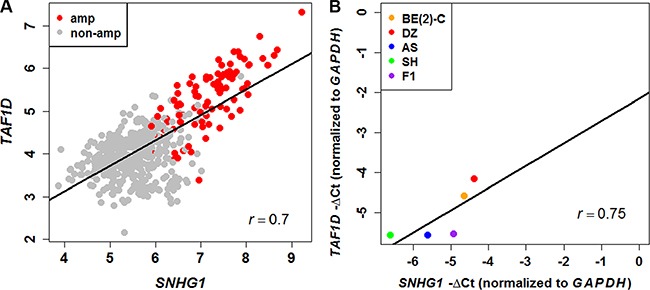
Figure 5. Positive correlation between SNHG1 and TAF1D expression.

(A) Scatter plot of SNHG1 and TAF1D expression levels in neuroblastoma patients measured by RNA-seq (n = 493) shows positive correlation. (B) The positive correlation was confirmed in NB cell lines via RT-qPCR (r = 0.75).
