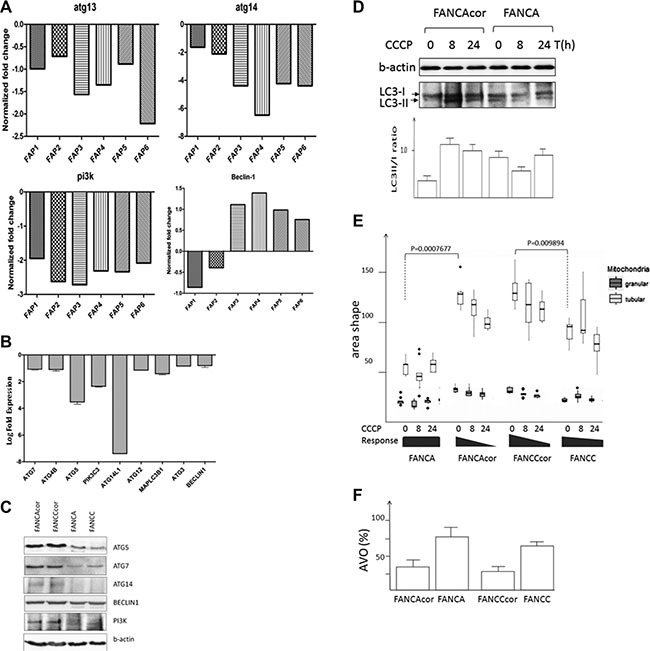
Figure 3. Mitophagy is impaired in FA cells.

(A) Microarray data depicting downregulation of some autophagy genes in FA patients vs. healthy individual or (B) in FA deficient vs. proficient cells. Total RNA isolated from peripheral blood of 6 Fanconi anemia patients from Andhra Mahila Sabha Hospital, Chennai, or from individuals with no symptoms of FA, was amplified and used for hybridization with the Human 40 K (A + B) OciChip array followed by Hybridization was performed using automated hubstation HS 4800. Hybridized chips were scanned using Affymetrix 428TM array scanner at three different PMT gains. Differentially expressed genes were filtered and the results represent the most downregulated mitochondrial genes. A threshold log fold change (LFC) of 3.0 was fixed to attain FDR of less than 0.05. The accession to the microarray datasets can be found in our earlier studies (29). (C) Corresponding protein profiles of FA cells. (D) Representative immunoblot of LC3 with FA cells treated with CCCP for the indicated time interval and diagram with signal intensities of LC3-II/I. The results are the multiple scanned (n = 4) of two independent blots, P = 0.0026 (E) Morphological changes of FA mitochondria upon treatment with CCCP. 2000 cells per well were stained with mitotracker-green and Hoechst and the cell images were acquired on Image Xpress Ultra scanning confocal microscope and analyzed using Cell Profiler. Statistical significance was determined by Wilcoxon rank sum test. (F) Percent of lysosomes and autophagolysosomes (AVO) as determined by AO staining of FA cells and corrected counterparts (P < 0.03, n = 4, t-test).
