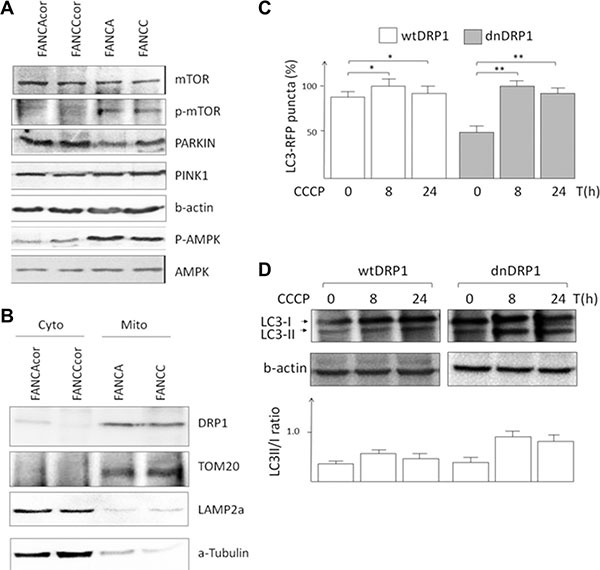
Figure 4. Impaired mitophagy in FA cells is dependent on mitochondrial fission.

(A) Immunoblots of possible autophagic markers. (B) Immunoblots of mitochondrial and cytoplasmic fractions of FA cells. (C) Fractions of FA cells transfected with wtDRP1 or dnDRP1 were enriched by FACS-sorting, treated with CCCP for indicated time intervals and transfected with LC3-RFP. Representative graph showing the average number of puncta signals in FANCA cells. *P < 0.05, **P < 0.03 The plasmids CMV_DRP1_IRES_mitoDsRed andCMV_DRP1dn_IRES_mitoDsRed expressing wild type and dominant negative DRP1 (DRP1dn = DRP1K38A). (D) Corresponding cell samples were processed for immunoblot analyses and the average signal intensities of LC3-II/I bands were plotted on a diagram.
