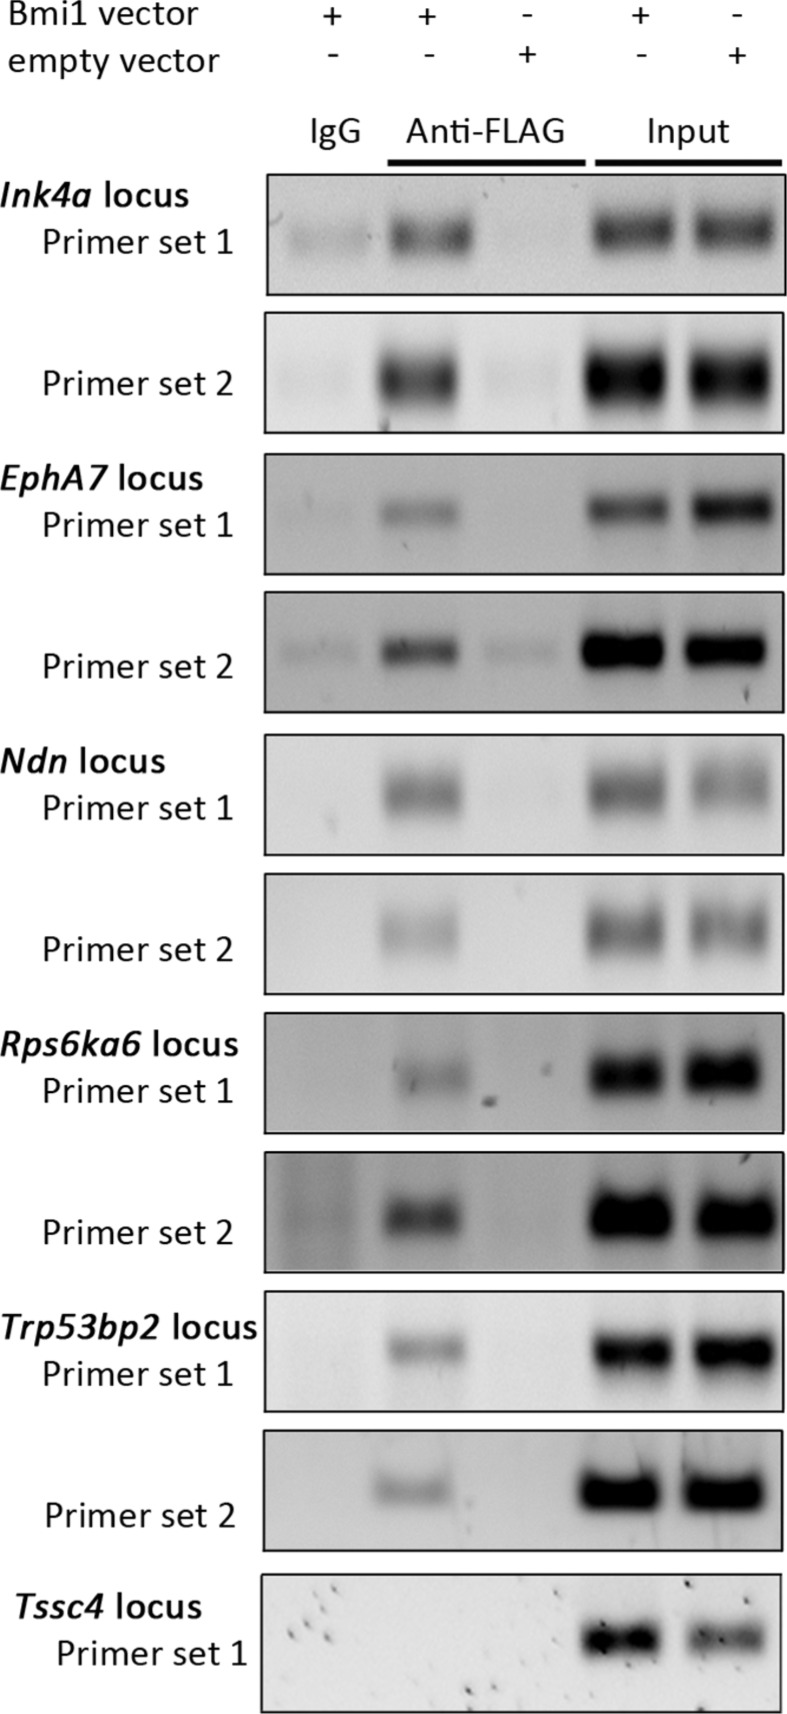
Figure 2. Identification of direct BMI-1 targets by ChIP.
Representative agarose gel electrophoresis images of PCR-amplified Ink4a, EphA7, Ndn, Rps6ka6, Trp53bp2 and Tssc4 genomic regions using material from ChIP samples and input controls as template (n = 3). ChIP was performed with empty vector (empty) and pCMMP-Bmi1-FLAG-transduced NSP cells, applying the anti-FLAG antibody M2. A matched IgG1 isotype antibody was used as negative control and post-sonication cell lysate served as input control. Tssc4 PCR results are shown as negative example.

