
Figure 5. ω-3 PUFAs-induced YAP phosphorylation and cytoplasm translocation is predominantly through the canonical Hippo Pathway.
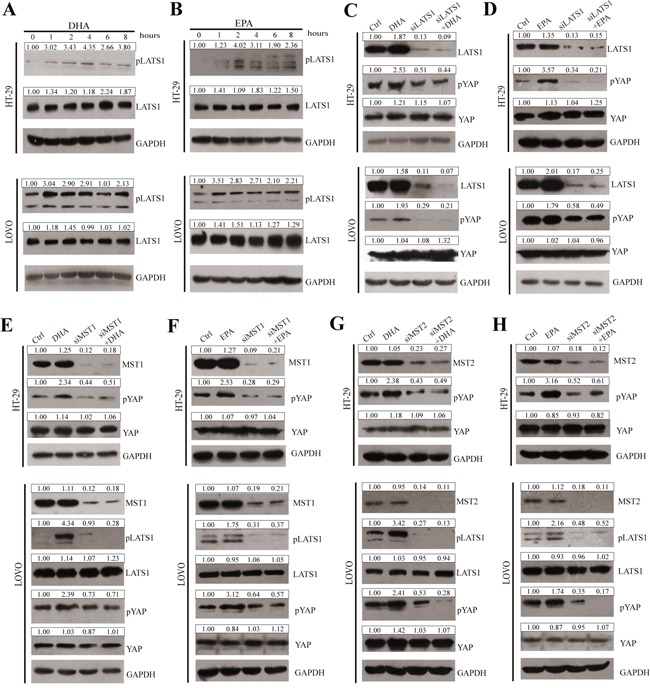
A and B. pLATS1 and LATS1 expressions were examined and quantified by western blot after HT-29 and LOVO cells were treated with 75μM DHA (A) or EPA (B) for indicated times. C and D. CRC cells were transfected with LATS1 siRNA for 48h, after transfection, cells were treated with 75μM DHA (C) or EPA (D) for additional 4h, pYAP, YAP and LATS1 expressions were examined and quantified by western blot in HT-29 cells and LOVO cells. E and F. CRC cells were transfected with MST1 siRNA for 48h, after transfection, cells were treated with 75μM DHA (E) or EPA (F) for additional 4h. pYAP, YAP, pLATS1, LATS1 and MST1 expressions were examined and quantified by western blot in HT-29 cells and LOVO cells. G and H. CRC cells were transfected with MST2 siRNA for 48 h. After transfection, cells were treated with 75 μM DHA (G) or EPA (H) for additional 4 h. pYAP, YAP, pLATS1, LATS1 and MST2 expressions were examined and quantified by western blot in HT-29 cells and LOVO cells. GAPDH served as the loading control. Bands were semiquantified by image intensity area under the curve. Intensity of specific band is normalized in relation to loading control protein intensity.