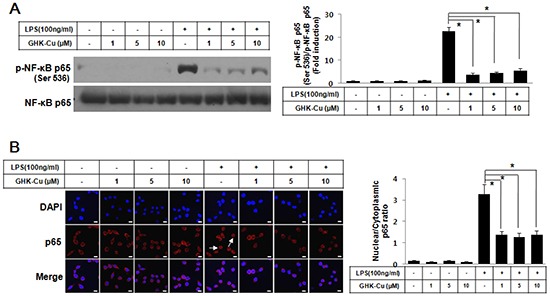
Figure 3. GHK-Cu blocked LPS-induced nuclear translocation of NF-κB p65 and phosphorylation of NF-κB p65 in LPS-induced RAW 264.7 cells activation.

A. Phosphorylation of p65 at Ser536 was assessed by western blotting of total cell lysates with a phosphorylation site-specific antibody. The values are the means ± SD after normalization based on total NF-κB p65 (n = 3). A representative blot is shown for each condition. The blots were subjected to a densitometric analysis and relative quantification. B. Immunofluorescence staining of NF-κB p65 and quantification of nuclear: cytoplasmic ratios of NF-κB p65 staining. A representative NF-κB p65 stain for these conditions is shown. White arrows indicate the localization of NF-κB p65 in the nucleus. The data represent the means ± SD from an analysis of three separate high-power-field images. *p < 0.05, statistically significant difference. CTL, control.
