
Figure 2. DF-HSA uptake by pancreatic carcinoma cells.
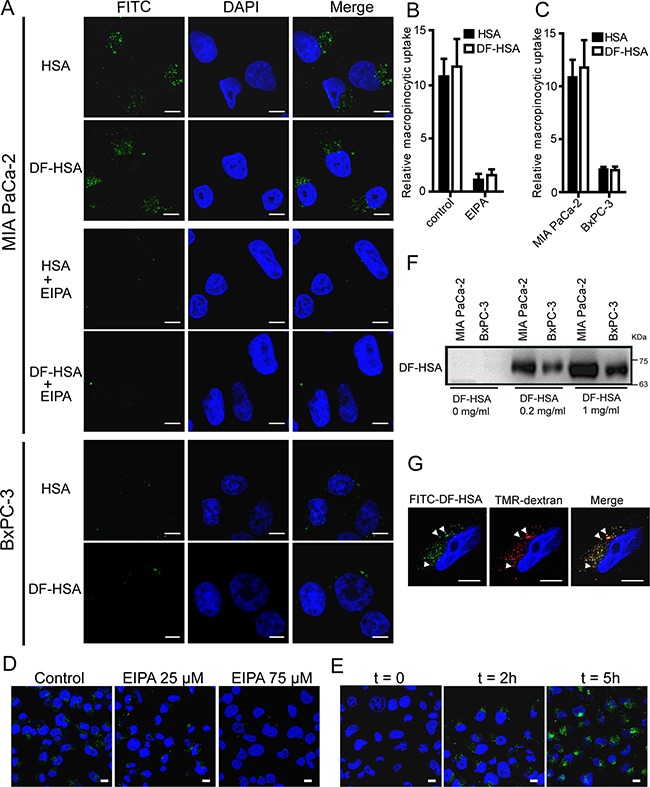
A. Confocal microscopic observation of MIA PaCa-2 and BxPC-3 cells treated with FITC-HSA and FITC-DF-HSA at 37°C for 2 h, and the difference in MIA PaCa-2 cells treated with 75 μM EIPA or not. B. Quantification of macropinocytic uptake in MIA PaCa-2 cells treated with 0 or 75 μM EIPA. Data are presented as arbitrary units relative to the values obtained in 75 μM EIPA condition. C. Quantification of macropinocytic uptake in MIA PaCa-2 and BxPC-3 cells. Data are presented as arbitrary units relative to the values obtained for BxPC-3 cells. D. Confocal microscopic observation on the macropinocytic uptake of FITC-DF-HSA in MIA PaCa-2 cells treated with 0, 25, and 75 μM EIPA, respectively. E. Analysis of FITC-DF-HSA fluorescence in MIA PaCa-2 cells exposed to FITC-DF-HSA for different time intervals (t = 0, 2 and 5 h, respectively). F. Western blot detection of the macropinocytic uptake of different concentrations of DF-HSA in MIA PaCa-2 and BxPC-3 cells using goat anti-HBD2 polyclonal antibody (1/200 dilution) and HRP-conjugated rabbit anti-goat IgG (1/5000 dilution). The cells exposed to DF-HSA in different concentrations (0, 0.2 and 1 mg/ml, respectively) at 37°C for 2 h. G. FITC-DF-HSA is internalized into discrete puncta in MIA PaCa-2 cells that co-localize (white arrowheads) with TMR-dextran. Green signals, FITC-DF-HSA and FITC-HSA; red signals, TMR-dextran; blue signals, DAPI staining identifies nuclei. For all graphs, error bars indicate mean ± SD for n = 3 independent experiments with at least 200 cells scored per experiment. Scale bar: 10 μm.