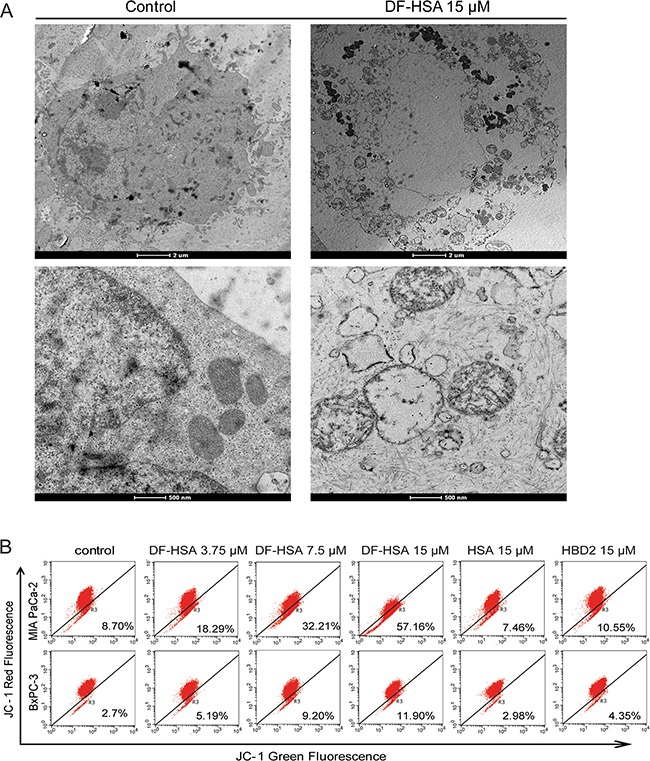
Figure 4. Effects of DF-HSA on ultrastructure and mitochondrial membrane potential in human pancreatic carcinoma cells.

A. Morphological observation with transmission electron microscopy in MIA PaCa-2 cell treated with 15 μM DF-HSA and the control. Upper row: scale bar, 2 μm; under row: scale bar, 500 nm. As shown, mitochondrial changes were found in the treated cells. B. Mitochondrial membrane potential of pancreatic carcinoma cells treated with HSA, HBD2 and different concentrations of DF-HSA was assessed by JC-1 fluorescent dye using flow cytometry analysis. The increment of green fluorescence (JC-1 monomer) and the decrease of red fluorescence (JC-1 aggregate) indicated the loss of mitochondria membrane potential in treated cells.
