
Figure 6. In vivo and ex vivo optical imaging in MIA PaCa-2 xenograft-bearing athymic mice using Dylight680-labeled DF-HSA.
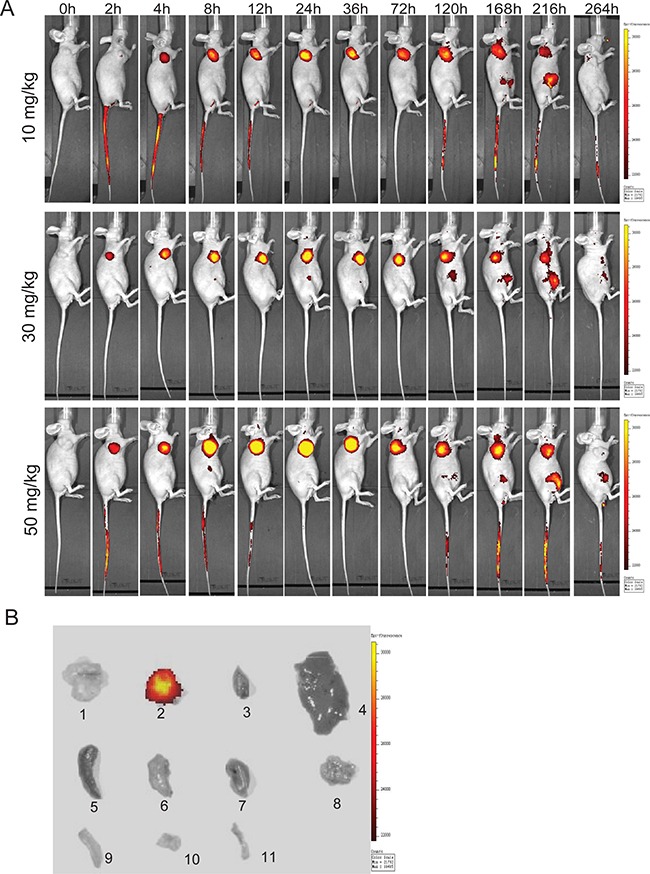
A. Representative in vivo fluorescence images at appointed times after tail vein injection of 10, 30 and 50 mg/kg DF-HSA. Color scale represents photons/s/cm2/steradian. B. Ex vivo fluorescence images, 1 was the excised tumor from untreated mouse; 2-11 were excised tumor, heart, liver, spleen, lung, kidney, pancreas, large intestine, small intestine and bone from the upper mouse in (A) at 120h.