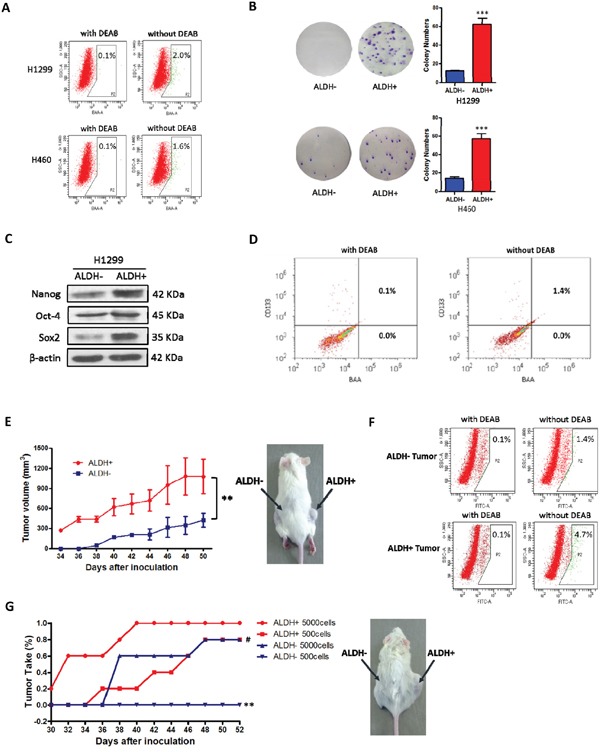
Figure 1. ALDH-positive cells represent cancer stem cells in some NSCLC cell lines.

A. ALDH-positive and ALDH-negative cells were isolated from the indicated NSCLC cell lines by FACS. Brightly fluorescent ALDH-expressing cells (ALDH-positive cells) were detected in the green fluorescence channel (BAA) using flow cytometry. DEAB, a specific inhibitor of ALDH, was used to establish the baseline fluorescence of these cells and to define the ALDH-positive region. B. Analysis of cell colony numbers in colony forming assays of ALDH-positive and ALDH-negative cells (***P < 0.001, χ2 test). C. Analysis of stem cell transcription factors by western blotting. D. Double staining of Aldefluor and CD133 (PE) in NCI-H1299 cells. E. Comparison of primary xenograft formation by sorted ALDH-positive and ALDH-negative NCI-H1299 cells in NOD/SCID mice (**P < 0.01, 2-tailed t test). F. The percentage of ALDH-positive cells in xenograft tumors derived from ALDH-positive and ALDH-negative cells. G. Comparison of tumor take (%) in NOD/SCID mice with secondary xenografts of ALDH-positive and ALDH-negative cells taken from primary xenograft tumors (**P < 0.01, χ2 test, compared with the ALDH+ 500 cells group; #P < 0.05, χ2 test, compared with the ALDH+ 5000 cells group).
