. 2015 Feb 9;6(1):201–208. doi: 10.14740/cr384w
Copyright 2015, Howie-Esquivel et al.
This is an open-access article distributed under the terms of the Creative Commons Attribution License, which permits unrestricted use, distribution, and reproduction in any medium, provided the original work is properly cited.
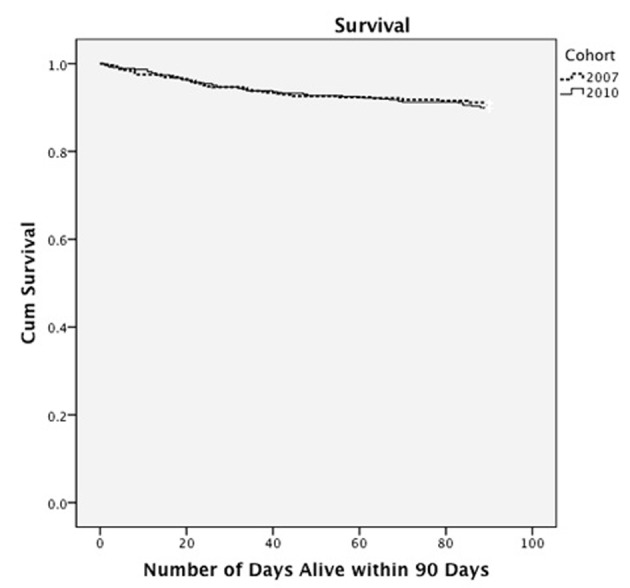
Figure 2.

Survival curve by cohort.
