Figure 1.
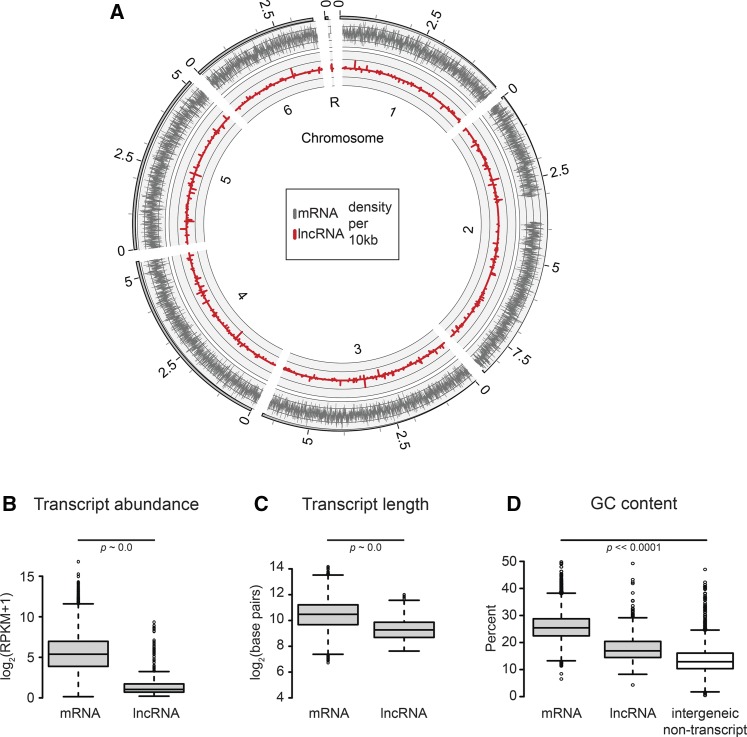
Long noncoding RNAs are distributed throughout the genome and are characteristically distinct from annotated mRNAs. (A) Transcript density is shown on a Circos plot. The outermost ring, shaded solid gray, represents the scale of each chromosome, in megabase pairs. The six chromosomes and the ribosomal palindrome are labeled inside the plot (1–6, R). The black bars/white spaces on chromosomes 2 and R mark large duplications for which reads are mapped only to one region. Transcript density was calculated as the percentage of base pairs per 10 kbp window that mapped to messenger mRNA (gray, outer plot) and lncRNA (red, inner plot). Each plot is scaled from 0 to 1, with top-strand transcripts above the zero-axis, and bottom-strand transcripts below this axis. The distributions of (B) maximum transcript abundance, (C) transcript length, and (D) GC content are shown on the y-axis of the box and whisker plots, with RNA type on the x-axis. In all cases, the box height represents the first to third quartiles and the horizontal line, the median value. Whisker bars mark 1.5-fold the 1st/3rd quartile range, with outliers displayed as circles. (B) Maximum transcript abundance was determined for each transcript model across all developmental time points, and is plotted on a log scale. (C) Transcript length was also log scaled. (D) For the comparison of GC content, in addition to the three RNA classes, we randomly sampled 1000 intergenic regions per chromosome that did not overlap with any transcript model. All four distributions were significantly different. For plots (B–D), p-values were determined by Mann-Whitney U-test. lncRNA, intergenic long noncoding RNA; mRNA, messenger RNA; RPKM, reads per kb per million.

