Figure 3.
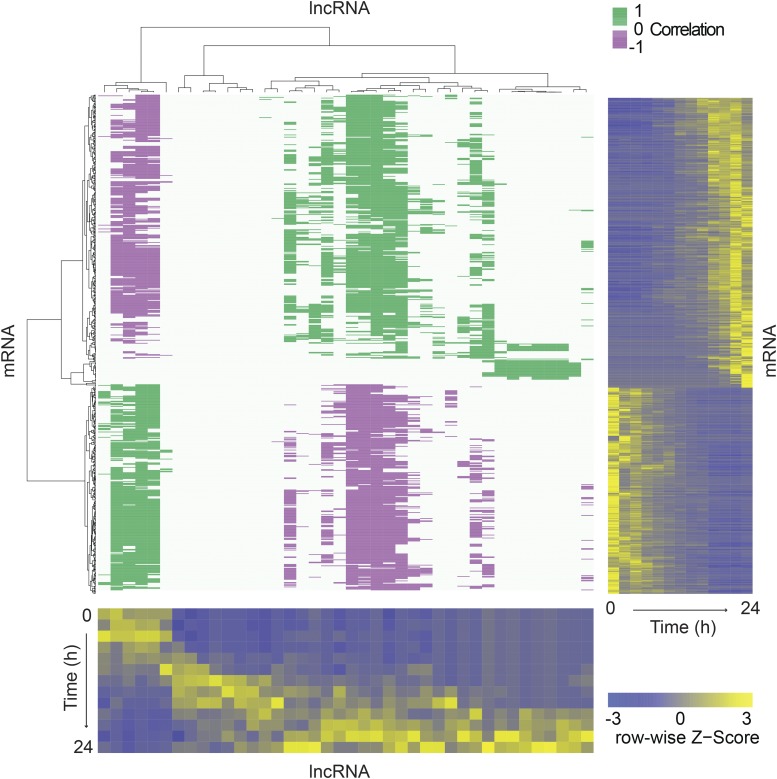
Subsets of lncRNAs are strongly correlated with mRNAs. The purple/green heatmap represents a matrix that relates the transcription profiles of 51 abundant lncRNAs (columns: x-axis dendrogram, bottom heatmap) with 858 developmentally regulated mRNAs (rows: y-axis dendrogram, side heatmap). Spearman’s correlation coefficients (false discovery rate < 0.01) are shown in green (≥0.85, positive correlation) and purple (≤−0.85, negative correlation) as indicated by the green/white/purple scale bar. Dendrograms display hierarchical clustering of transcripts based on their abundance during development, which is shown in the blue/yellow heatmaps. The color range is scaled to the row-wise Z-distribution as indicated by the blue/yellow scale bar. In these heatmaps, one axis represents developmental time points, from 0 to 24 hr in 2 hr increments as indicated, and the other axis represents individual transcripts. lncRNA, intergenic long noncoding RNA; mRNA, messenger RNA.

