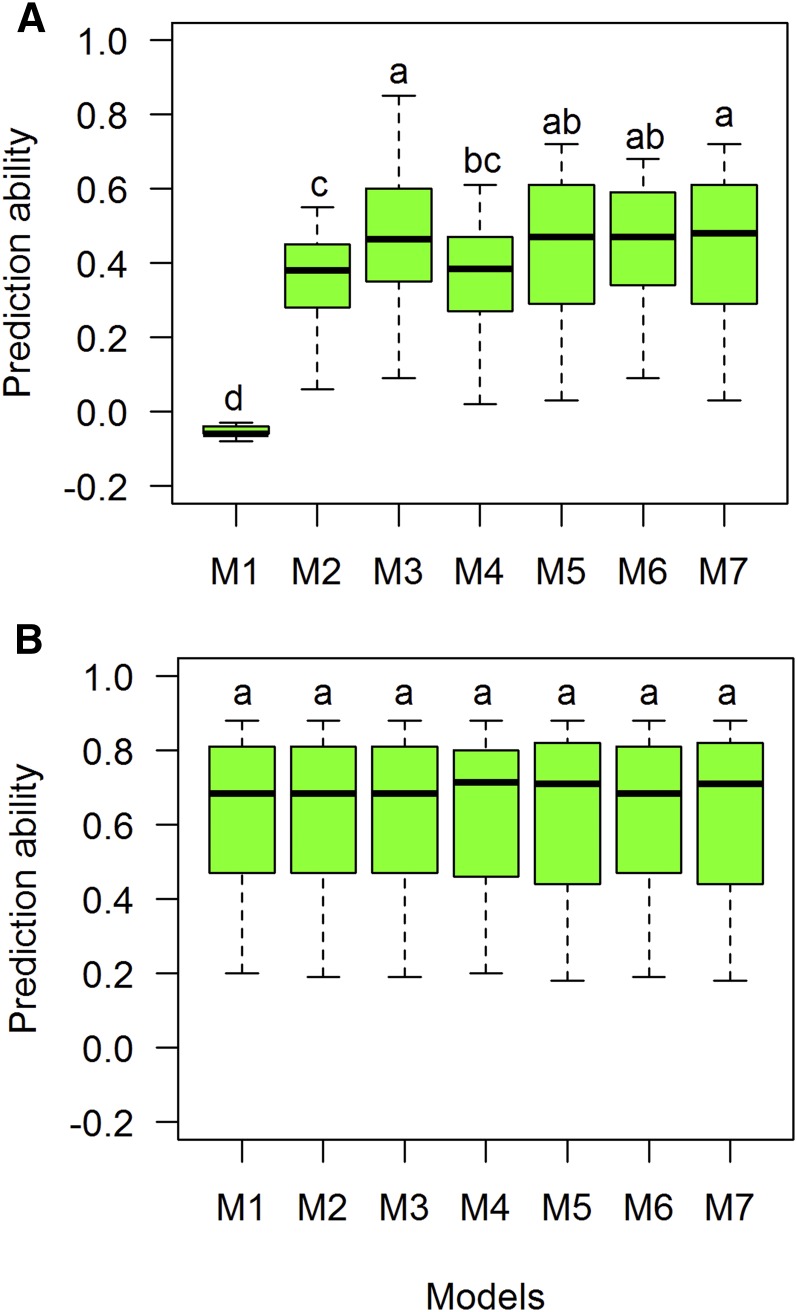
Figure 6.
Comparison of boxplot distributions of prediction ability (correlations) for each model (M1–M7) for trait grain weight using two prediction CV scenarios: (A) CV1 and (B) CV2 for trait GW. Different letters denote significant differences among groups (post hoc nonparametric Tukey’s test, P < 0.05). Models: M1 Y = E+L+e; M2 Y= E+L+A+e; M3 Y= E+L+G+e; M4 Y= E+L+A+AE+e; M5 Y= E+L+G+GE+e; M6 Y= E+L+G+A+e; M7 Y= E+L+G+A+GE+AE+e.

