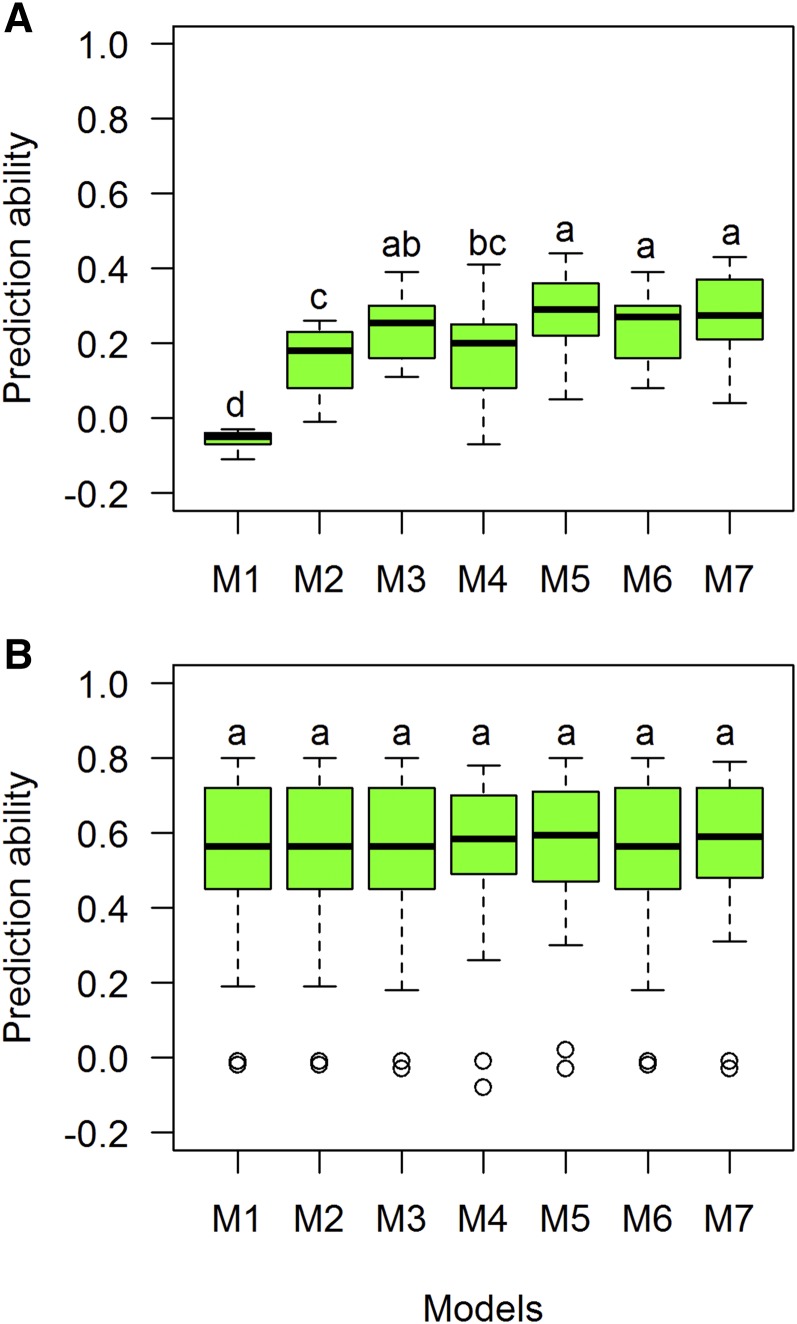
Figure 7.
Comparison of boxplot distributions of prediction ability (correlations) for each model (M1–M7) for trait grain number using two prediction CV scenarios (A) CV1 and (B) CV2 for trait thermal time to flowering (TTF). Different letters denote significant differences among groups (post hoc nonparametric Tukey’s test, P < 0.05). Models: M1 Y = E+L+e; M2 Y= E+L+A+e; M3 Y= E+L+G+e; M4 Y= E+L+A+AE+e; M5 Y= E+L+G+GE+e; M6 Y= E+L+G+A+e; M7 Y= E+L+G+A+ GE +AE+e.

