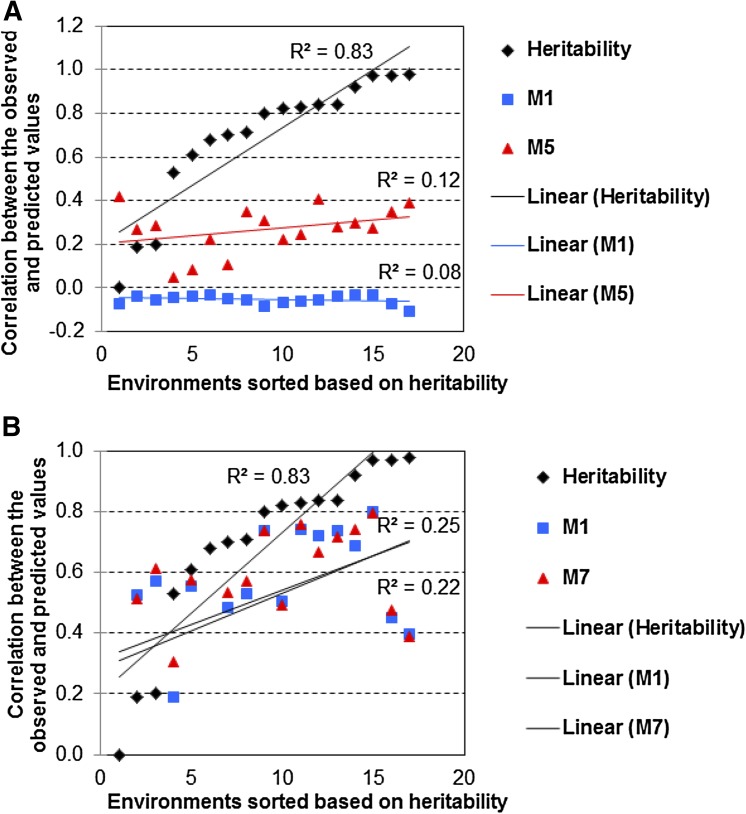
Figure B4.
Comparison between heritability values and the correlation between observed and predicted values for the best and worst models in predicting trait TTF in different environments for two cross-validation scenarios: (A) CV1 (the best and worst models were M5 and M1, respectively) and (B) CV2 (the best and worst models were M7 and M1, respectively).

