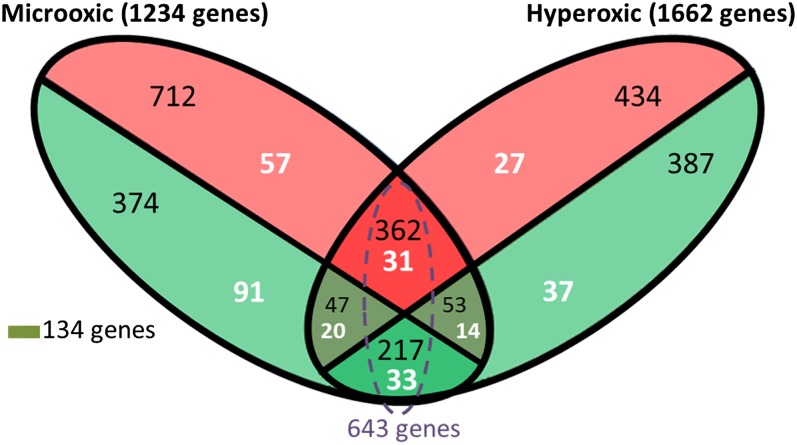
Figure 2.
Venn diagram showing transcriptional units differentially expressed under microoxic and hyperoxic conditions. The red and green ellipsoid areas represent genes up regulated and downregulated, respectively. The number of differentially expressed sRNAs is shown in white, while the number of mRNAs is shown in black. The sum of some areas is shown to facilitate understanding of our results.

