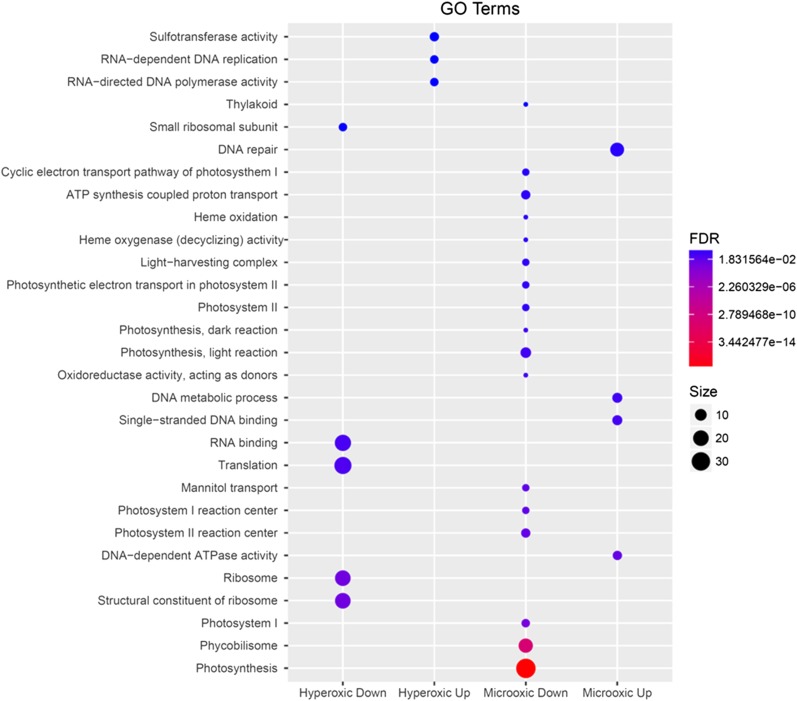
Figure 3.
Representation of the results obtained after a standard functional enrichment analysis of differentially expressed genes using GO terms. Only categories with a FDR < 0.1 are shown (all other results are available in Table S4). The size of the circles is proportional to the number of genes in that category, reflecting differential expression, while color indicates their confidence level or FDR value. The graph was generated using the R package ggplot2.

