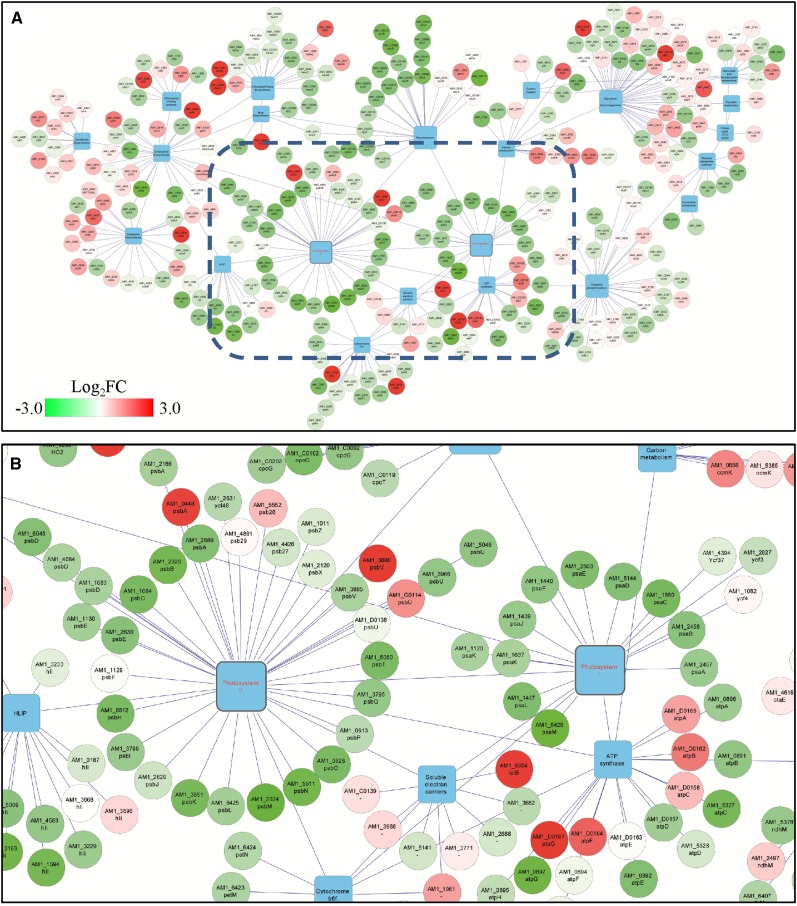
Figure 4.
Expression data mapped onto gene network generated using Cytoscape (Lopes et al. 2010). Protein-coding genes (circular nodes) were linked to their associated KEGG pathway (square nodes), and colored based on their Log2FC (fold change) under microoxic compared with control conditions, according to the gradational color bar shown in the top panel. (A) KEGG pathways relevant to our results. The blue rectangle in (A) marks the part of the network that is enlarged in (B), showing PSI, PSII, soluble electron carriers, and ATP synthase complexes.

