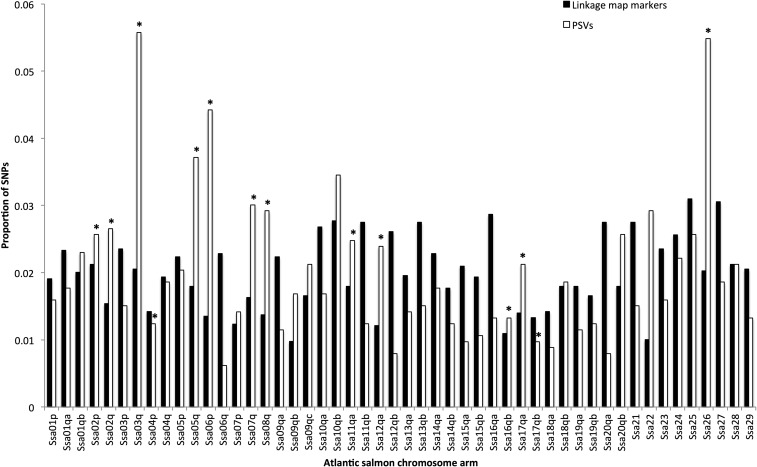
Figure 4.
The top BLASTn hit locations of Arctic charr linkage map SNPs, and Arctic charr PSVs, across Atlantic salmon chromosome arms. The data are shown in the proportion of hits from a category (Map SNPs or PSVs) in order to account for the bias of Atlantic salmon chromosome size. Arms with a * are HRTAs identified in Lien et al. (2016).

