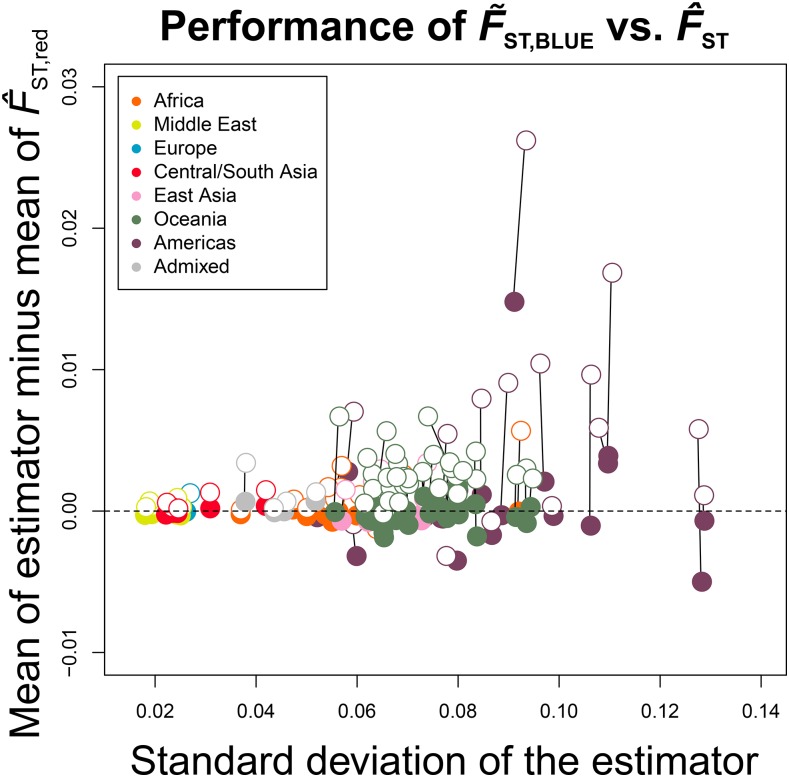
Figure 6.
Application of the estimators and to the estimation of as and respectively, from empirical data. Similarly to Figure 4, the difference between the mean of the estimator of (either derived from or ) and an unbiased estimator (derived from ), is displayed on the vertical axis, while the SD of the estimator is displayed on the horizontal axis. The empty circles represent the Reynolds et al. (1983) estimator (identical to the -derived estimation), while the filled circles represent the estimation derived from Here, the values for the French sample with each of the 92 other samples containing related individuals in the dataset MS5795 are plotted, colored by the region of the changing sample.

