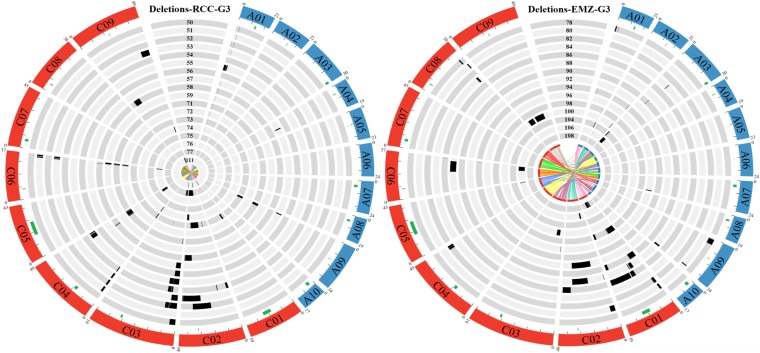
Figure 4.
Graphical representation of the deletions identified in each “RCC” (left) or “EMZ” (right) G3 plant. The B. napus chromosomes belonging to the A and C subgenomes are shown in blue and red, respectively. The size of each chromosome (in megabases) is indicated above each chromosome, and a ruler is drawn underneath each chromosome, with larger and smaller tick marks every 10 and 2 Mb, respectively. The locations of active centromeres (Mason et al. 2016) are indicated by green rectangles under each chromosome. Each circle represents one G3 plant. For each individual, a black rectangle represents a deleted region. The last inner circle corresponds to the homeologous relationship between the A and C chromosomes.

