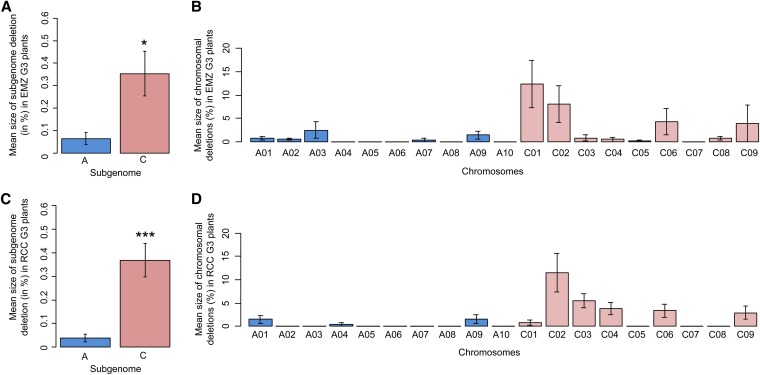
Figure 5.
Mean size of subgenome deletions (in megabases) in EMZ (A) or RCC G3 plants (C). The mean size of deletions per chromosome (in megabases) for EMZ (B) or RCC plants (D) is also presented. The presence of significant differences using the Wilcoxon rank-sum test (Wilcoxon 1945) is indicated by a star(s).

