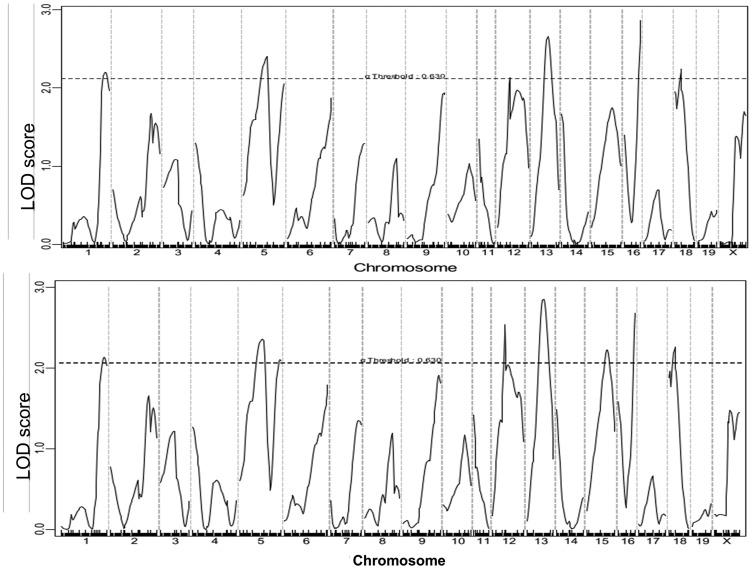
Figure 2.
Genome-wide QTL analysis for carotid lesion sizes in the F2 population. Chromosomes 1 through 20 are represented numerically on the x-axis. y-axis represents LOD score. The horizontal dashed line denotes the genome-wide threshold for suggestive linkage, which was determined by 1000 permutations. Top panel: a genome-wide scan using untransformed carotid lesion data performed with the nonparametric algorism; bottom panel: a genome-wide scan using log2-transformed carotid lesion data performed with the parametric mode. LOD, logarithm of the odds; QTL, quantitative trait locus.

