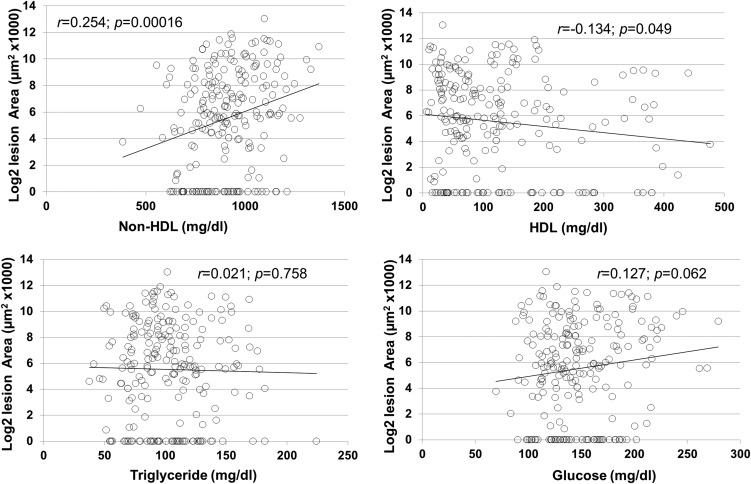
Figure 5.
Scatterplots showing the correlations of carotid lesion sizes with plasma non-HDL (A), HDL cholesterol (B), triglyceride (C), and glucose (D) in the F2 population. Each point represents an individual value of a F2 mouse. The correlation coefficient (r) and significance (p) are shown. Log2-transformed carotid total areas were used for the analyses. HDL, high-density lipoprotein.

