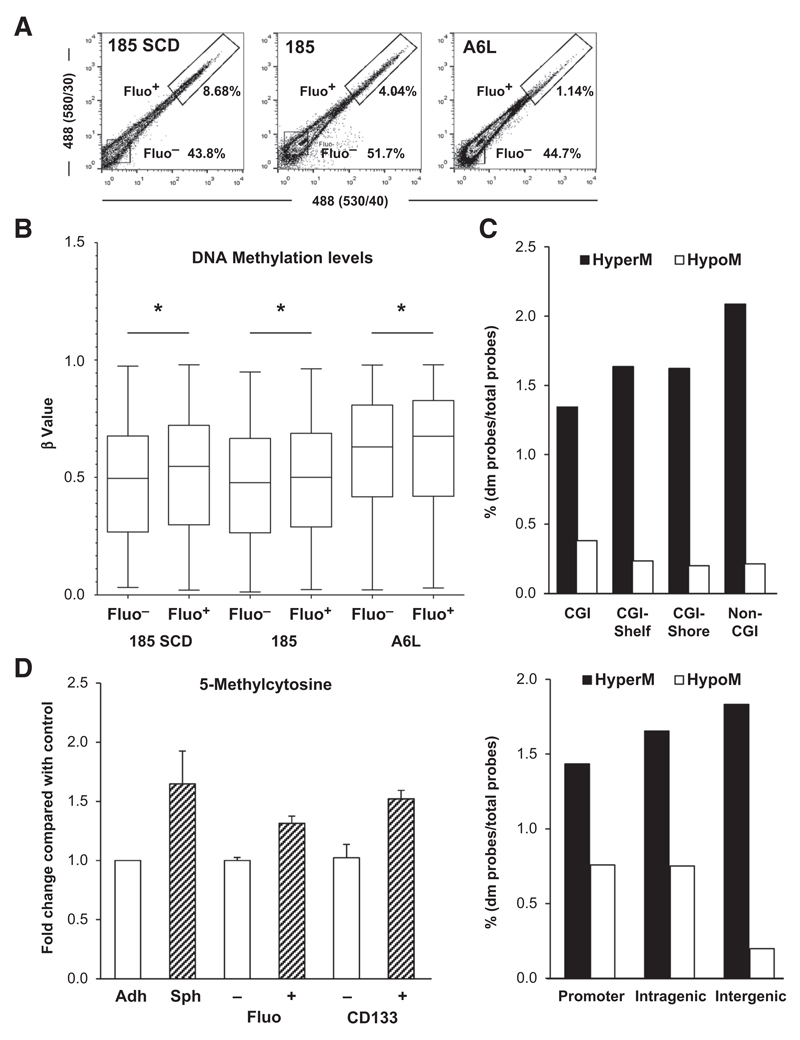
Figure 1. Pancreatic CSCs bear higher levels of DNA methylation.
A, flow cytometry analysis of autofluorescence in sphere-derived cells from PDAC-185 SCD (PDAC tumor derived from a single PDAC 185 autofluorescent cell), PDAC-185 (primary tumor), and PDAC-A6L (PDAC liver metastasis). B, box plots representing DNA methylation levels in representative pairs of autofluorescent-negative (Fluo–) and -positive (Fluo+) cells from the indicated primary PDAC sphere-derived cultures (*, P < 0.05). C, distribution of differently methylated (dm) probes based on their genomic location relative to CpG islands (CGI; top). M, methylated. CpG island shores represent regions 0 to 2 kb from CpG islands; shelves indicate regions 2 to 4 kb from CpG islands. Distribution relative to the promoter (upstream the transcription start site), and intragenic and intergenic nonpromoter regions (bottom). D, quantification of 5mC using the MethylFlash Quantification Kit in non-CSCs versus CSCs (adherent vs. sphere, Fluo– vs. Fluo+, and CD133– vs. CD133+). adh, adherent; sph, spheres. Data are shown as fold change compared with non-CSC (mean ± SD; n = 3).

