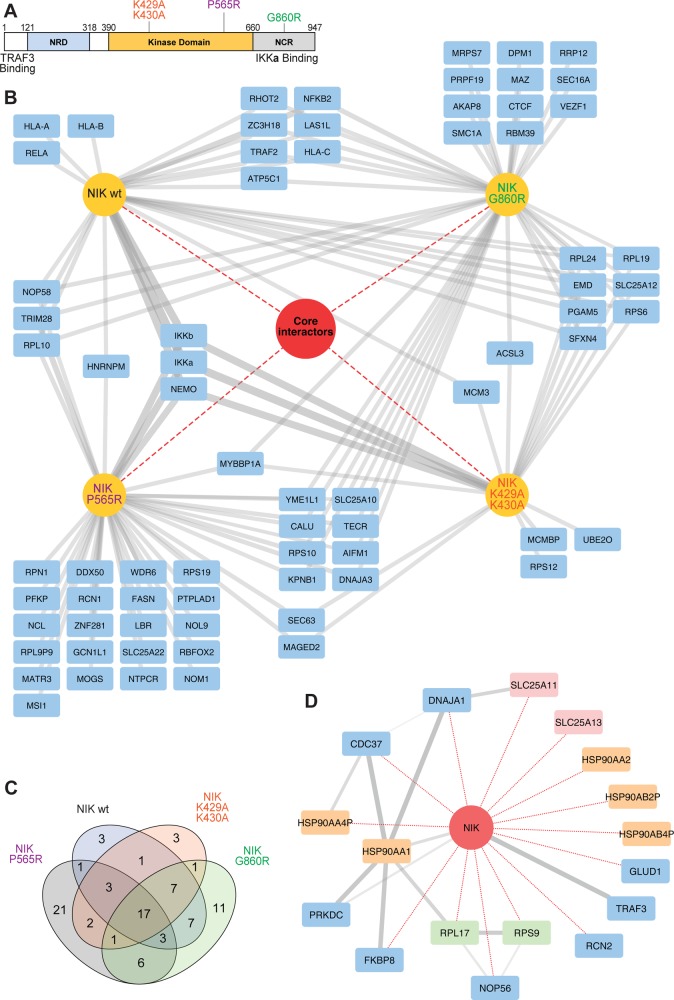
Figure 4.
Interactions of NIK wild-type and mutants. (A) Schematic depiction of the NIK protein indicating the domains and mutants relevant to this study.41 (B) Interaction comparison of NIKwt, NIKG860R, NIKK29R/K430A, and NIKP565R. In the network, SH-tagged proteins and interactors are colored yellow and blue, respectively. Core interactors shared by all variants are represented within the red circle. (C) Venn diagram depicting the number of interactors that overlap between the different NIK variants. (D) Network depiction of NIK core interactors. NIK is indicated as a red circle. Edges in red and gray depict interactions identified in this study and interactions retrieved from the STRING database, respectively. Interactors colored in yellow, green, and red denote HSP90 complex members, ribosomal complex members, and SLC25 family members, respectively.

