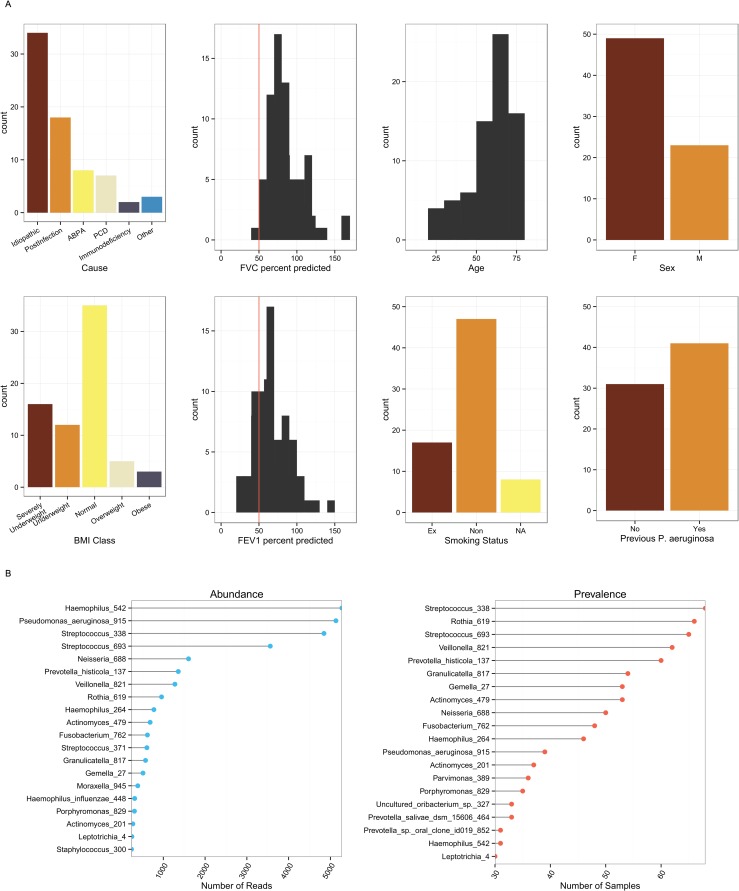
Fig 1.
1A. Demographics of the non-CF bronchiectasis cohort. Indicating distribution of (from left to right, top to bottom): the cause of bronchiectasis; FVC percent predicted (red line indicates 50%); subject age; subject sex; BMI class; FEV1 percent predicted (red line indicates 50%); smoking status; and whether subject has previously cultured P. aeruginosa. 1B. Distribution of OTUs within the cohort. Abundance is the total number of reads assigned to an OTU from any sample. Prevalence is how often an OTU is detected in samples. Haemophilus_542 was most abundant, contributing 16% of all reads in the dataset. Streptococcus_338 was most prevalent and was found to some degree in every sample.

