Fig 2.
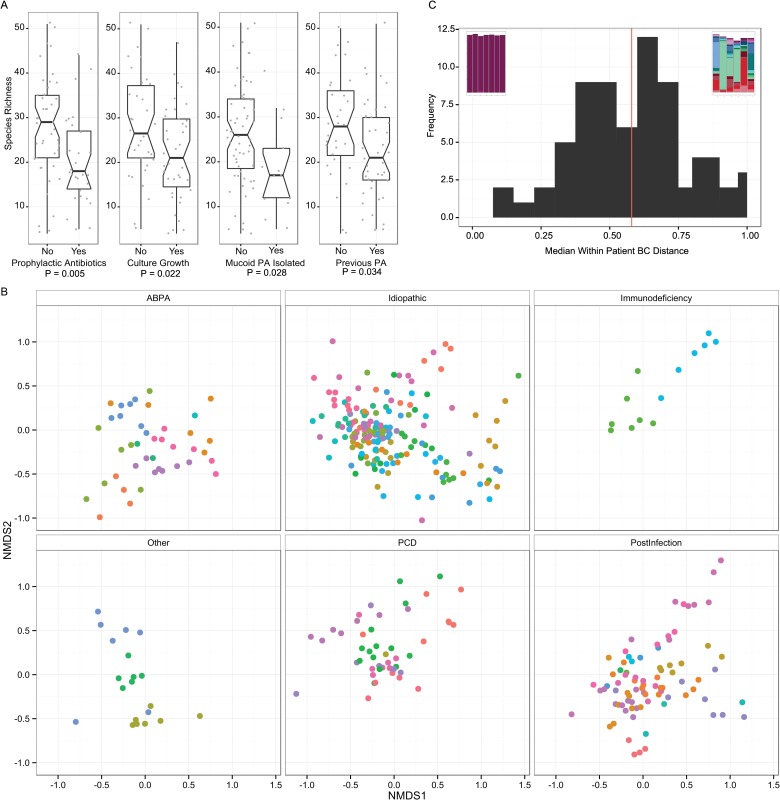
2A. Boxplots of species richness for cross-sectional baseline samples comparing clinical categories. Notches indicate 95% confidence interval. P values were calculated using Welch’s T test. 2B. Non-metric multi-dimensional scaling plot of Bray-Curtis dissimilarity. This ordination plot visually represents the Adonis results. The plot has been split by underlying cause of non-CF bronchiectasis to reduce over-plotting and to enable clearer visualisation of clustering of points, although each panel can be considered to be directly overlaid upon one another. Each point represents a sample and the larger the distance between points the larger the difference in community structure of those samples. Samples from the same patient have the same colour. Samples from the same patient tend to cluster together, illustrating the high individuality. There is some separation of points evident in the underlying diseases, e.g. Post-infectious samples tend to be present in the bottom right of the plot, PCD top right, ABPA central bottom and idiopathic more widely distributed. 2C. Histogram of the median per patient Bray Curtis dissimilarity. Bray Curtis dissimilarity was calculated for each patient with more than 3 samples and ranged from 0·12 to 0·98. The embedded stacked bar plots illustrate the patients at the two extremes, least diverse and most stable to most diverse and variable.

