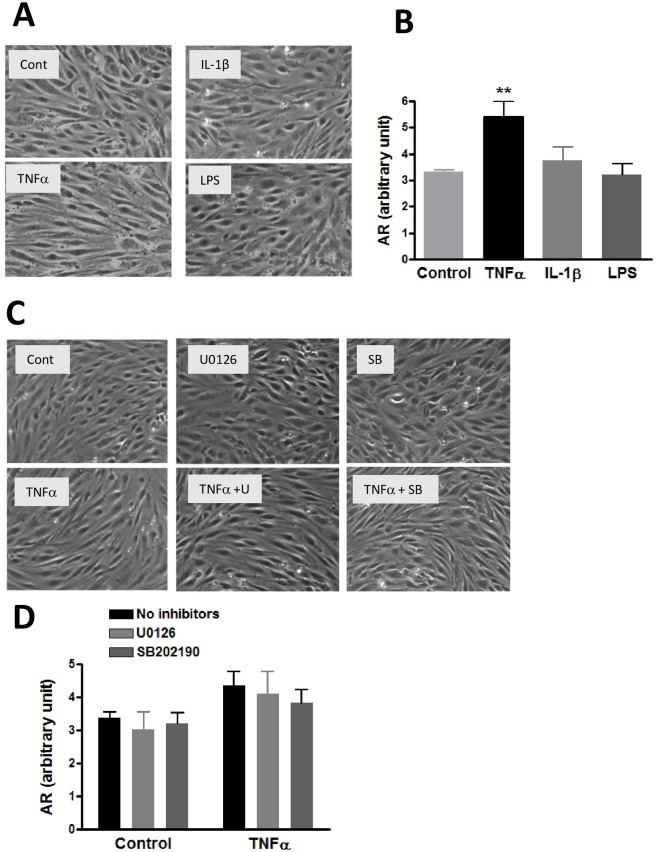
Fig 9. Effects of TNFα, IL-1β and LPS on morphology of hCMEC/D3 cells.
(A) Cells were treated with or without TNFα (10 ng/mL), IL-1β (10 ng/mL) and LPS (100 ng/mL) for 24 hours and observed under bright field microscope as described in text. Representative pictures were taken from different areas in the field. (B) Ten cells from each picture were randomly selected for measurement using the Image J protocol. Results are mean ± SD from 3 experiments. One-way ANOVA with Bonferroni post-test showed a significant difference (p<0.01) between control and TNFα. (C) Representative bright field photomicroscope pictures to assess effects of MEK1/2 and p-p38MAPK inhibitors on TNFα-induced morphological changes. Cells were pretreated with U0126 (2 μM) and SB202190 (2 μM) for 15 min prior to treatment with TNFα (10 ng/mL) for 24 h. (D) Results are analyzed as in (B). Data are expressed as the mean ± SD of three experiments. Two-way ANOVA showed a significant main effect of TNFα (p = 0.0013). The effects of the inhibitors were not significant.

