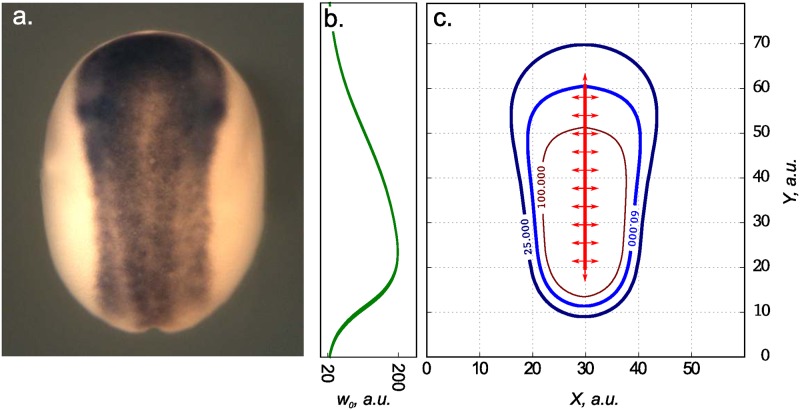
Fig 7. Modeling of the neural plate’s shape in the early Xenopus laevis gastrula.
The neural plate at the X. laevis midneurula visualized by the whole-mount in situ hybrydization with dig-labeled probe to the pan-neural marker, Sox2 (a). Distribution of HSPG sites in ECM used as w0(x) for simulation of model (3) (b). Level curves for stable structures formed by activator (Chordin) in the simulation of model (3) for t = 1000 (c). Model parameters are: k1 = 1.0, k−1 = 0.01, ρ = 0.6, μu = 0.01, μv = 0.05, D = 0.1.

