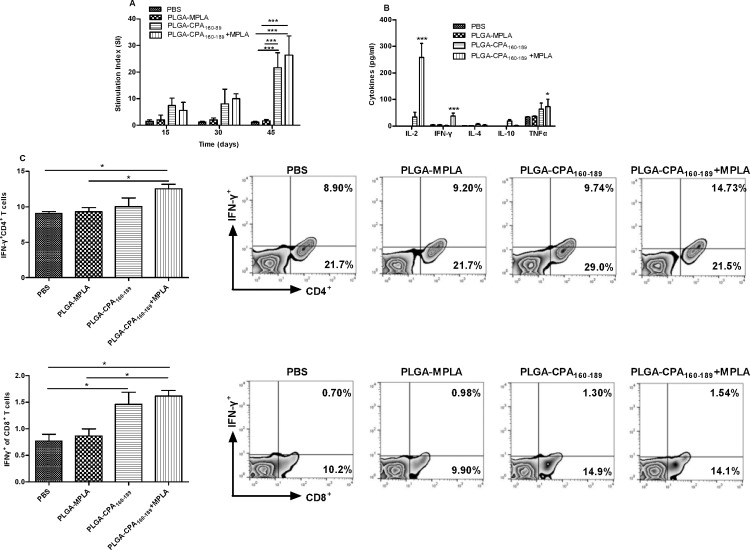
Fig 5. Determination of CPA160-189-specific cellular responses in PLGA NPs-vaccinated mice.
(A) CPA160-189-specific proliferation of spleen cells obtained from mice vaccinated at different time points. Control group was vaccinated with PBS. Results are expressed as mean stimulation index (S.I.)±SD from three independent experiments. (B) CPA160-189-specific IL-2, IFN-γ, IL-4, IL-10 and TNFα production from spleen cells isolated two weeks after the end of vaccinations from vaccinated and non-vaccinated mice. (C) Diagram showing detection of CPA160-189-specific IFN-γ production by CD4+ and CD8+ T cells by flow cytometry analysis with representative dot plots, two weeks after the end of vaccinations. Results are presented as means±SD of five individual mice per group, representative of two independent experiments with similar results. *p<0.05, **p<0.01, ***p<0.001 for proliferation and cytokine assays were assessed by two-way ANOVA and Bonferroni’s multiple comparison tests, whereas flow cytometry results were assessed by one-way ANOVA and Tukey’s multiple comparison tests.

