Figure 6.
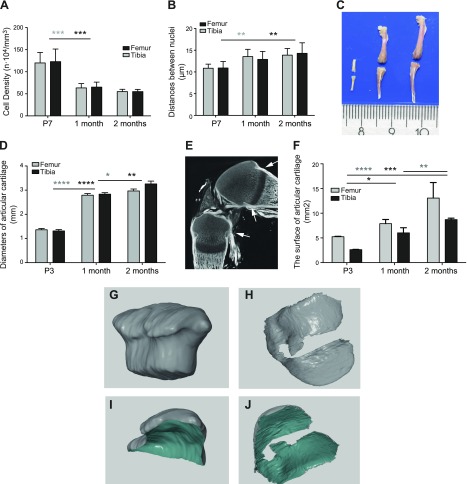
Growth and reshaping of mouse articular cartilage. A, B) 3D confocal analysis of nuclear density (A) and of the distance between adjusted nuclei (B) was performed on 150-μm sections stained with DAPI by using Imaris software. C, D) Representative images of the femur and tibia at age 3 d and 1 and 2 mo (C) and the corresponding epiphyseal diameters measured (D). E) Micro-CT with phosphotungstic acid contrasting allowed visualization of soft tissues, such as cartilage, tendon, and all connective tissues, as shown for the 3-d-old knee joint. Arrows show the Ranvier grove delineating the cartilage surface for determination of the surface area at age 3 d. F) Manual segmentation of these scans allowed quantitative analysis of the area of the cartilage surface. G–J) Segmented cartilage was measured employing GOM Inspect 8.0 software as exemplified for 3-d-old knee cartilage (G, I) and 1-mo-old (H, J) tibial cartilage. The gray color depicts the outer and green the inner surface of articular cartilage. Values are presented as means ± sd; n = 9 (A, B, D, F) *P < 0.05; **P < 0.01; ***P < 0.001; ****P < 0.0001, as analyzed by one-way ANOVA.

