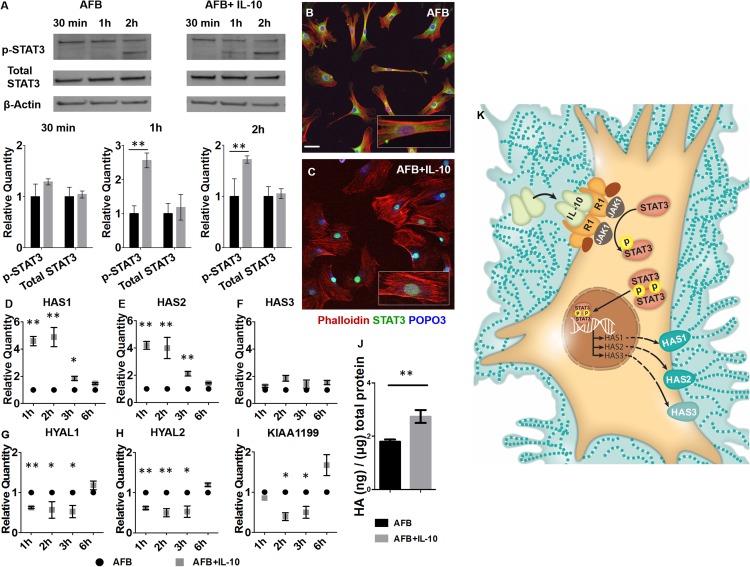
Figure 2.
IL-10 induction of HA synthesis via phosphorylation and nuclear translocation of STAT3, and the differential regulation of HASs and HYALs. A) Western blots of p-STAT3 and total STAT3 in AFBs in response to IL-10 stimulation at 30 min and 1 and 2h. β-Actin was analyzed as a loading control. Densitometric analysis of means ± sd of 3 experiments is shown in the bar plots. B, C) Cells were labeled with a STAT3 Ab and the representative images, with zoomed in insets, for the perinuclear STAT3 staining in control AFB (B) as well as the nuclear translocation of activated STAT3 after AFB stimulation with IL-10 for 60 min (C) are shown. D–I) Gene expression of HAS1 (D), HAS2 (E), HAS3 (F), HYAL1 (G), HAS2 (H), and KIAA1199 (I) in IL-10–stimulated AFBs at 1, 2, 3, and 6 h after stimulation with IL-10. Bar plots represent mean ± sd for 2 experiments. J) HA ELISA for AFBs 24 h after IL-10 (200 ng/ml) stimulation. Means ± sd of 3 experiments. K) Schematic illustration of the IL-10 pathway (see also Supplemental Fig. S2). Scale bar, 50 μm. *P < 0.05, **P < 0.01 by ANOVA and post hoc Bonferroni tests.

