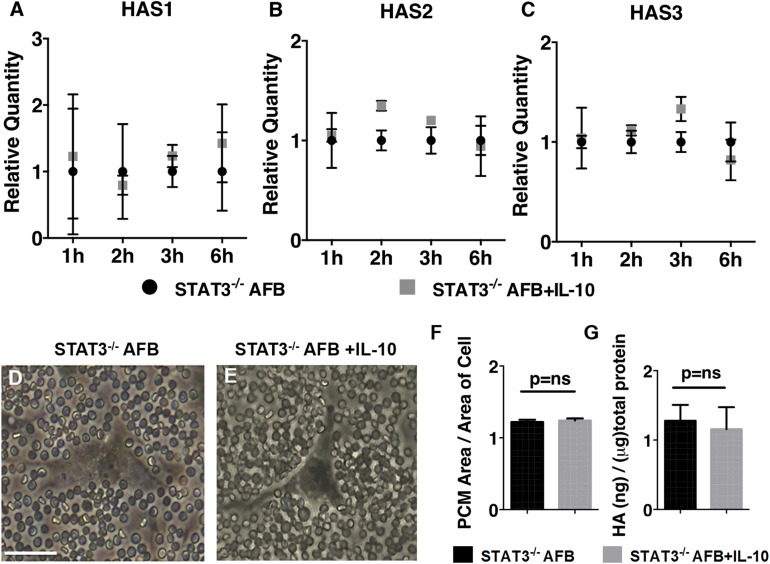
Figure 4.
IL-10–induced effects on regulation of HAS1-3 and HA-rich PCM are mediated via STAT3 signaling. A–C) Time course for mRNA expression of HAS1 (A), HAS2 (B), and HAS3 (C) in STAT3−/− AFBs with or without IL-10 treatment. Bar plots represent means ± sd of 2 experiments. D, E) Pericellular HA coat assessment via particle exclusion assay in STAT3−/− AFBs (D) and STAT3−/− AFBs treated with IL-10 (E). F) PCM ratio and means ± sd of 3 experiments (20 cells analyzed per experiment) are shown for STAT3−/− AFBs and STAT3−/− AFBs treated with IL-10 (200 ng/ml) for 24 h. G) HA levels in culture medium of STAT3−/− AFBs and STAT3−/− AFBs treated with IL-10 (200 ng/ml) for 24 h. Means ± sd of 3 experiments (see also Supplemental Fig. S3). Scale bar, 50 μm. ns, not significant.

