Figure 7.
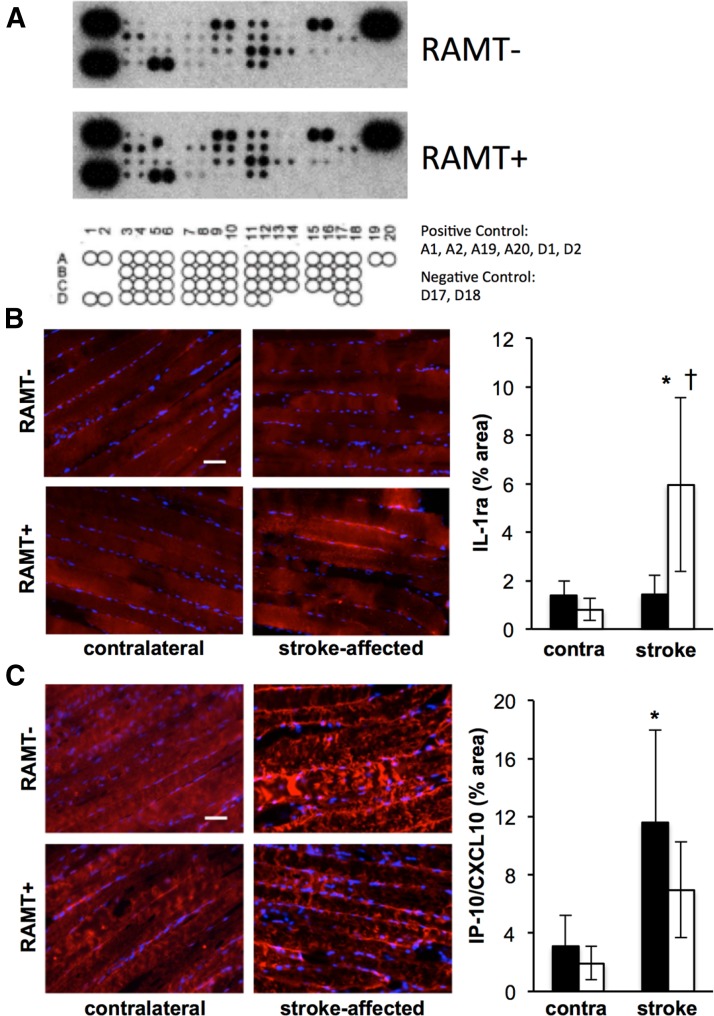
Cytokine profile of stroke-affected skeletal muscle in response to RAMT. A) Images of chemiluminescent intensity from the cytokine array. Rat cytokine array coordinates indicate the position of cytokines measured in Table 1. Optical density of each signal was measured by ImageJ, and values were calculated based on the signal intensity of the positive controls from the same membrane. B, C) Immunohistology was used to validate targets with the greatest fold-change up (IL-1ra, B) and down (IP-10/CXCL10, C). Immunohistology was quantified as % area in contralateral and stroke-affected gastrocnemius muscle of RAMT− (black bars) and RAMT+ (white bars) rats. Data are means ± sd (n = 4). *P < 0.05 vs. contralateral within group, †P < 0.05 vs. stroke-affected RAMT−.

